Project Introduction: Deploying SOAR platform tools
This project implements a Security Orchestration, Automation, and Response (SOAR) solution using TheHive, Fleet Server, Elasticsearch, and Kibana within a homelab environment.
By centralizing alert processing, automating security workflows, and integrating real-time threat intelligence, this deployment follows NIST 800-53 and ISO 27001 security best practices to create an efficient incident response framework.
This project showcases practical security automation techniques aligned with enterprise SOAR best practices for scalable and compliant security operations.
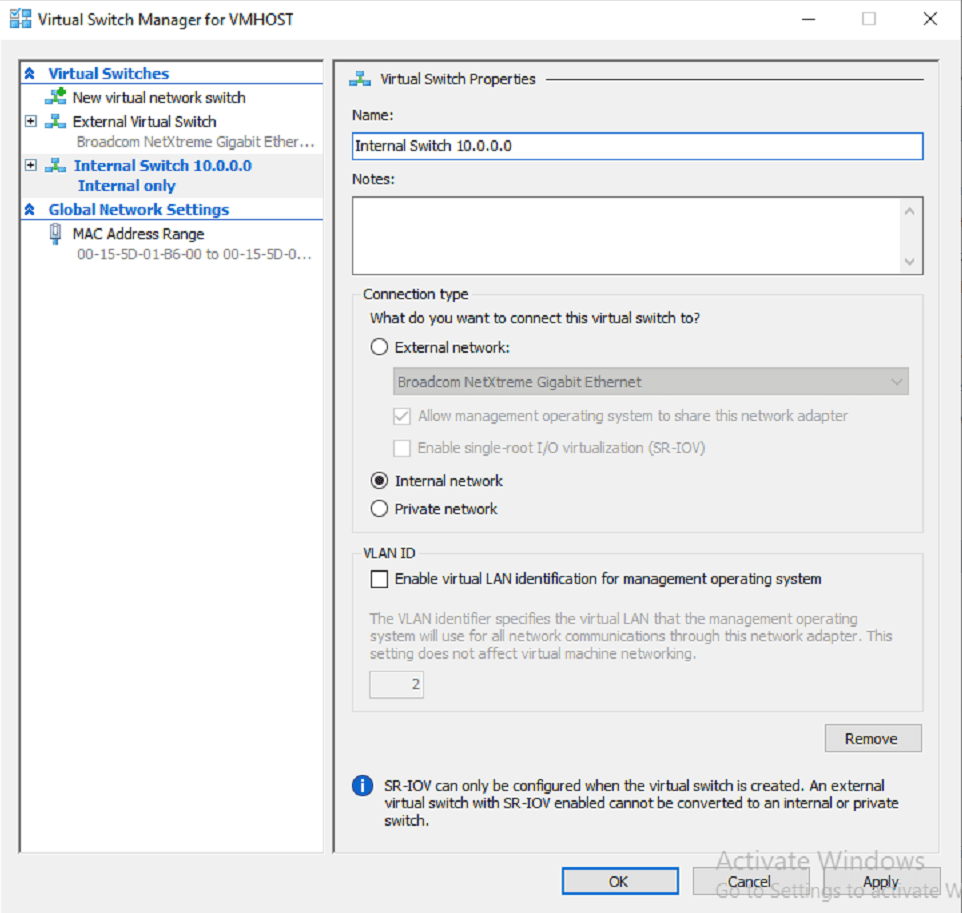
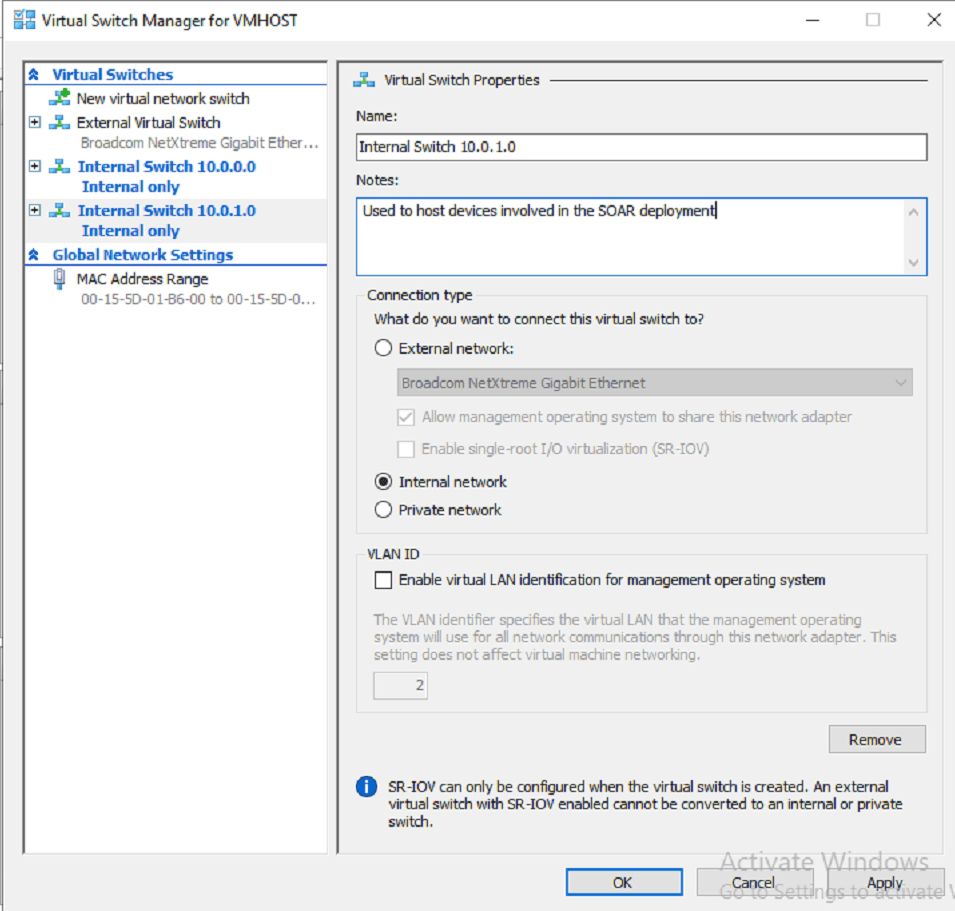
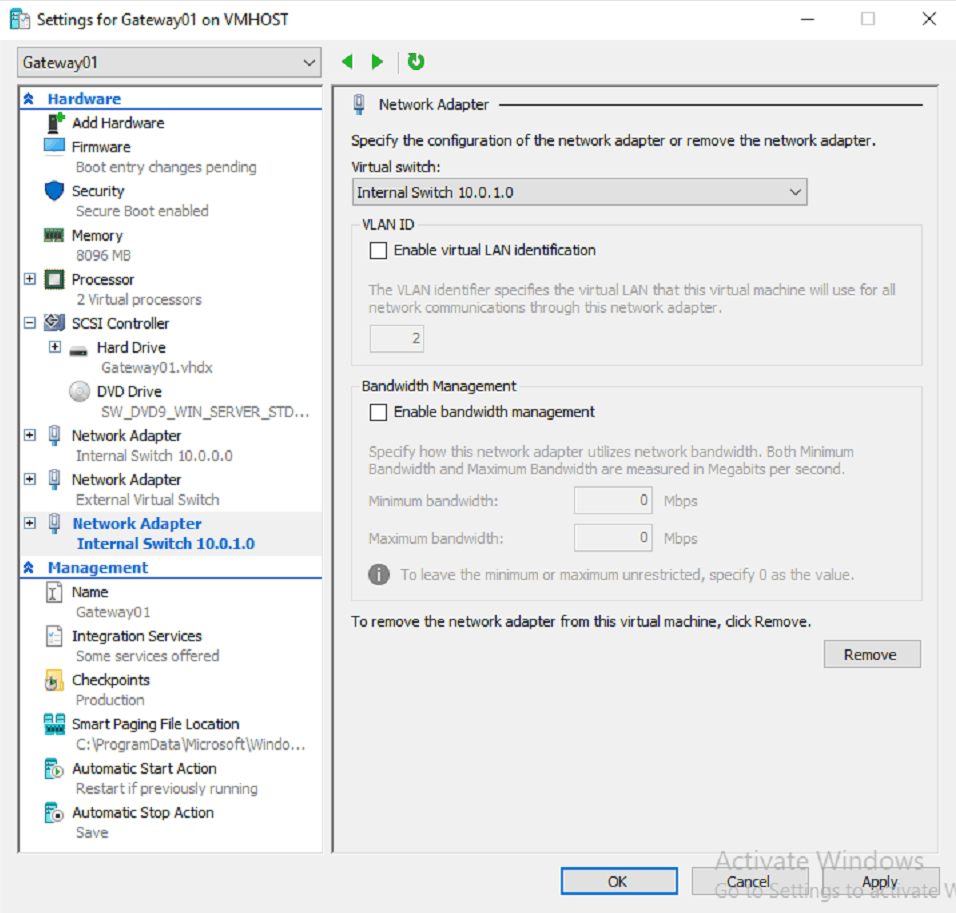
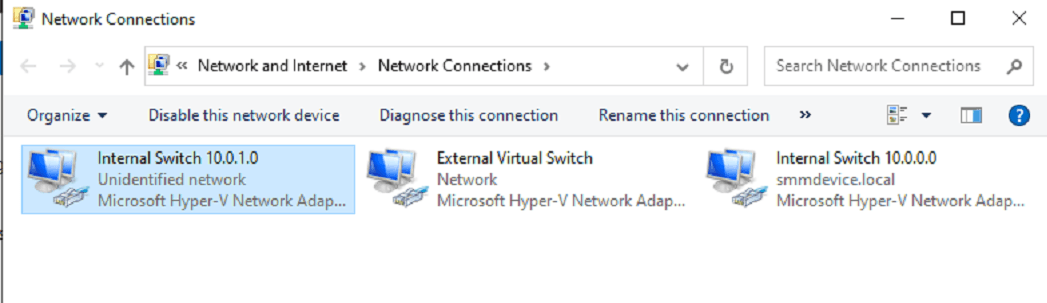
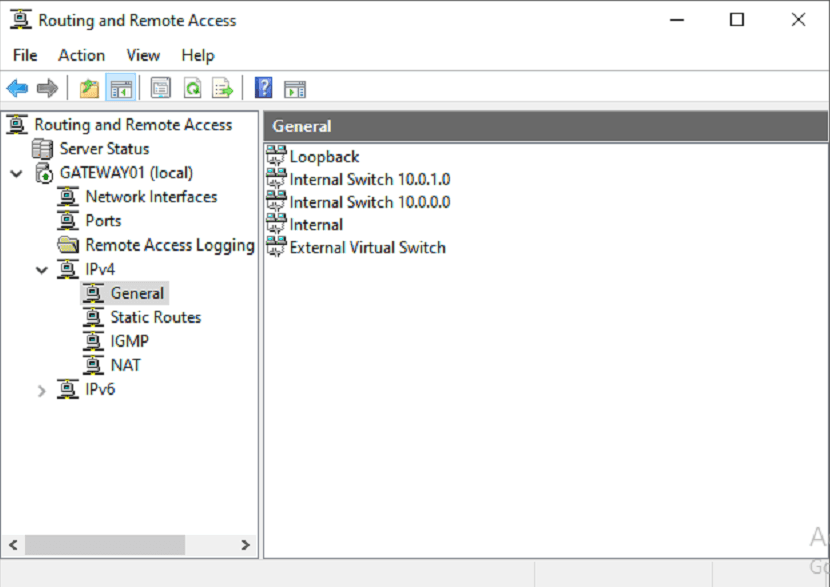
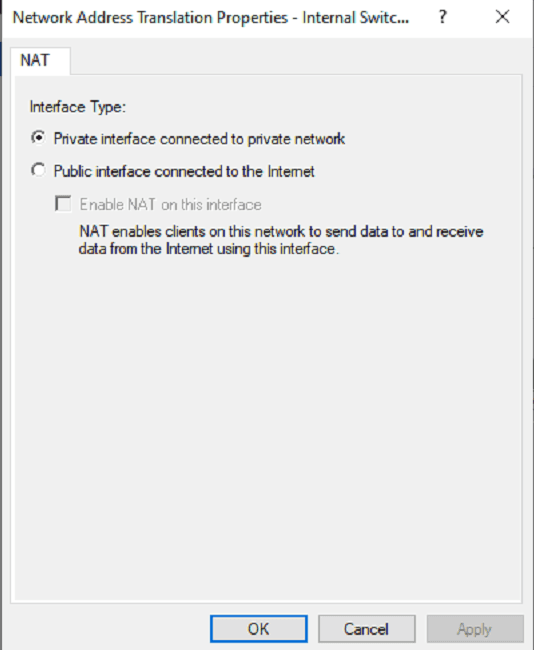
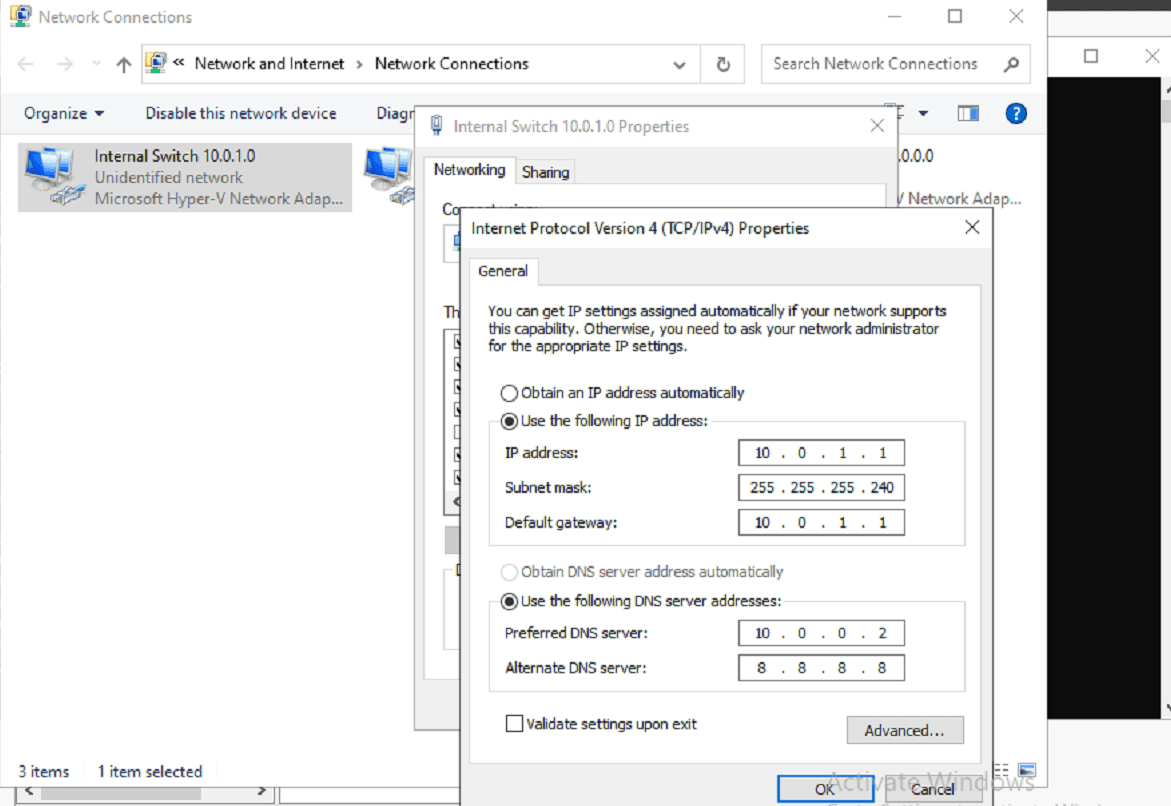
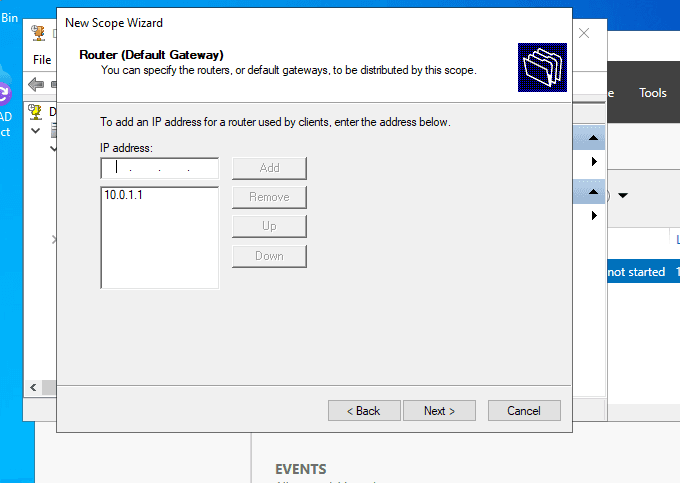
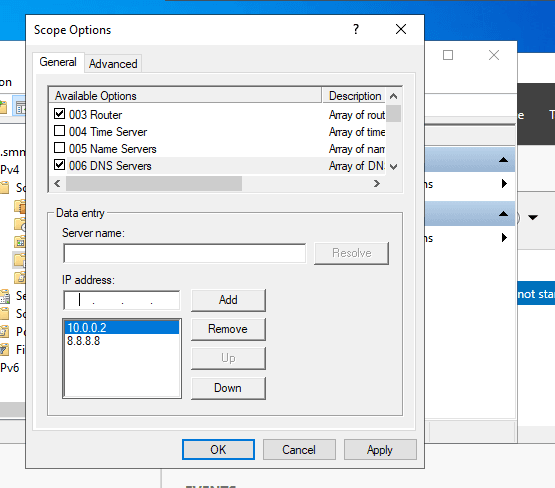
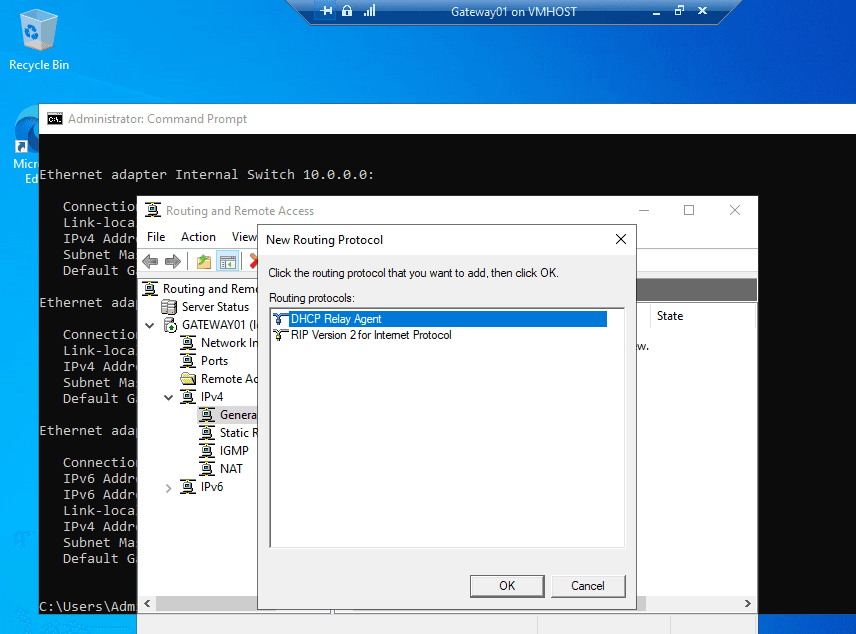
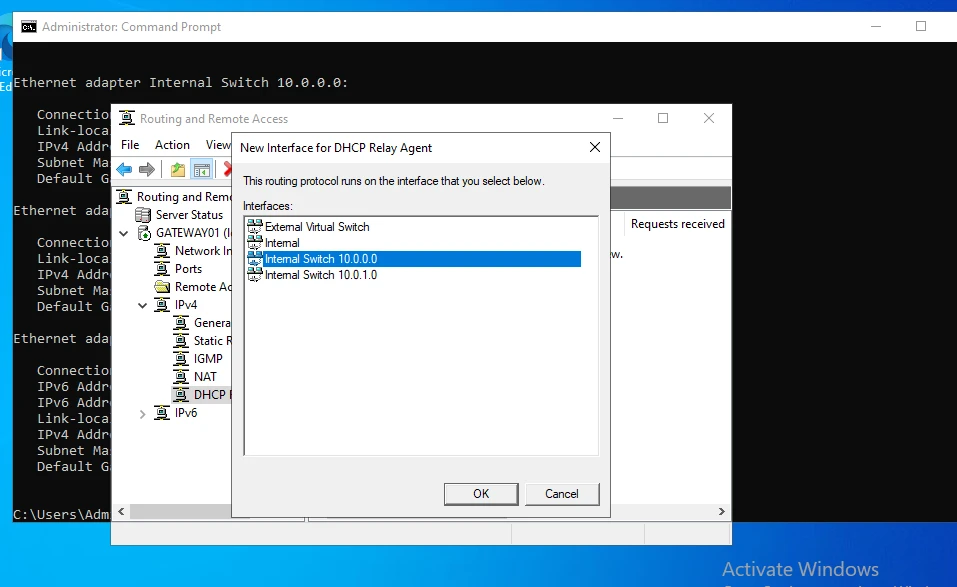
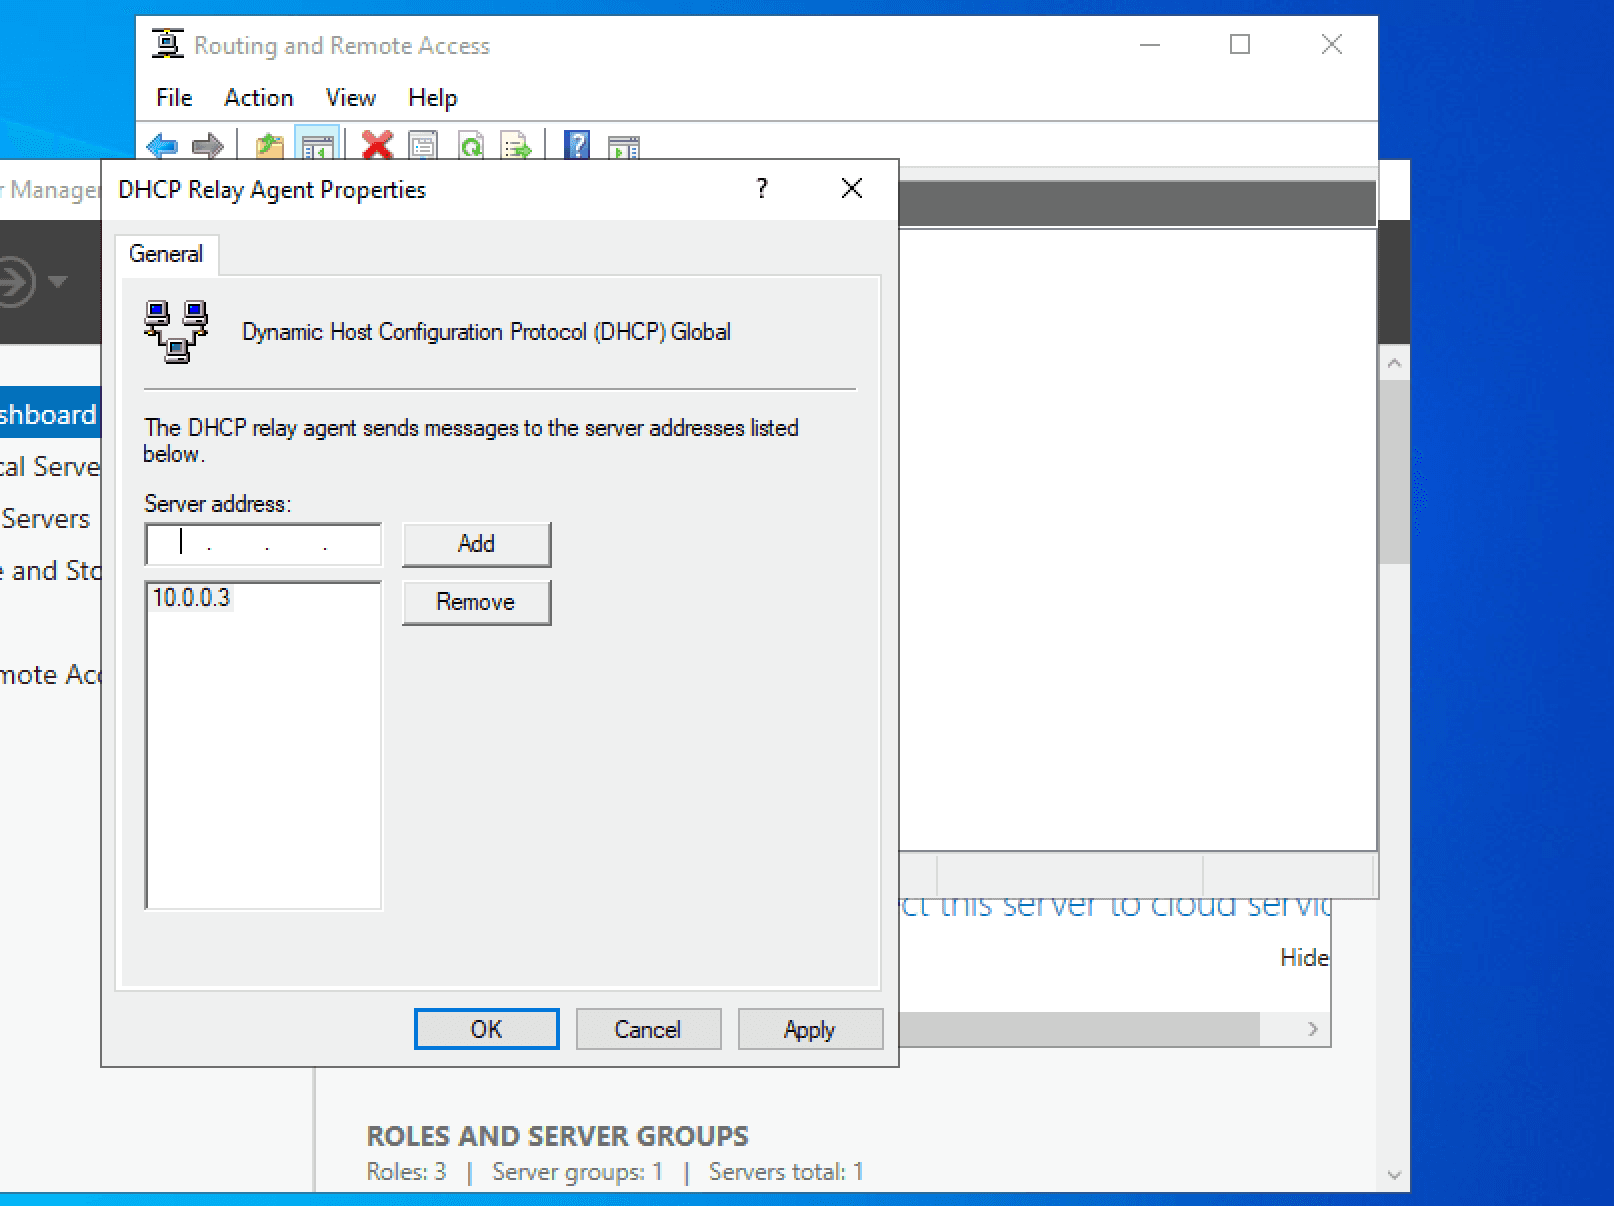
New Subnet Addition
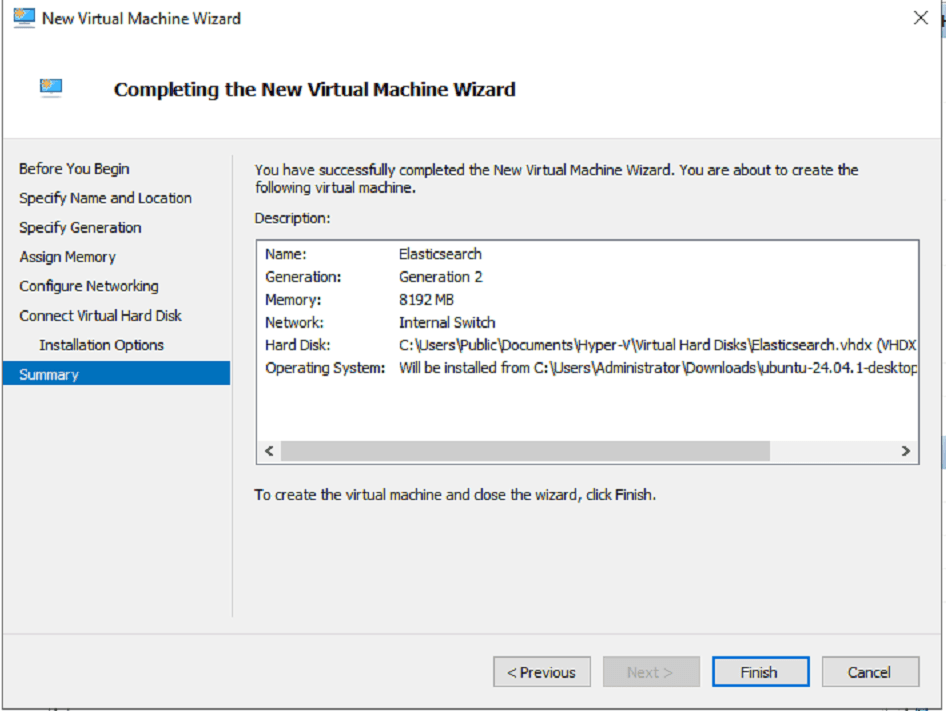
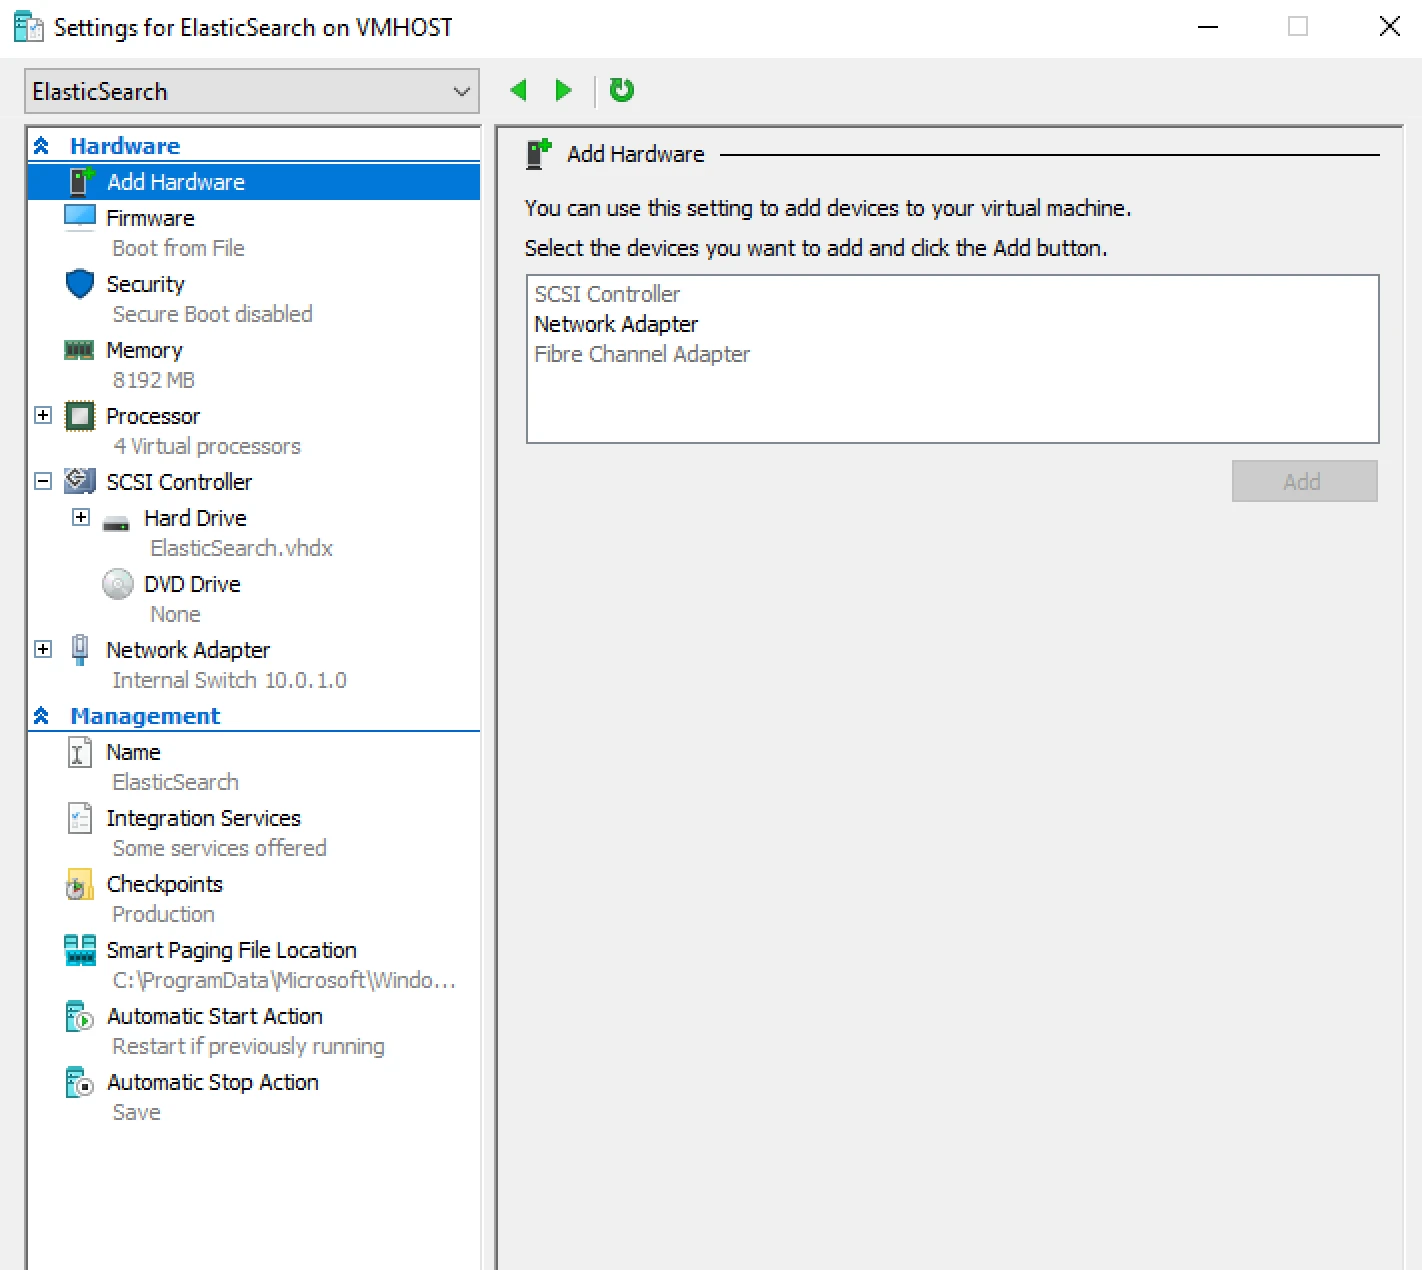
II. Elasticsearch Deployment
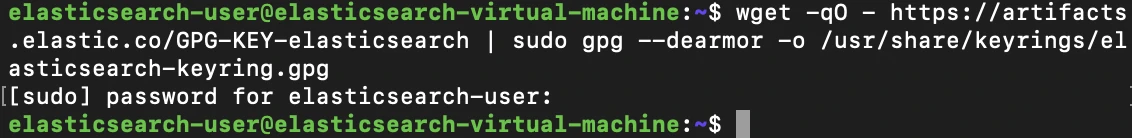
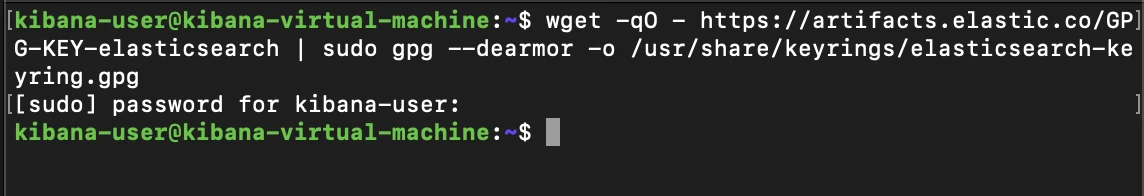
Next, we'll run:
This will allow us to import the Elastic PGP key for adding Elastic's repository to our package manager's source list.
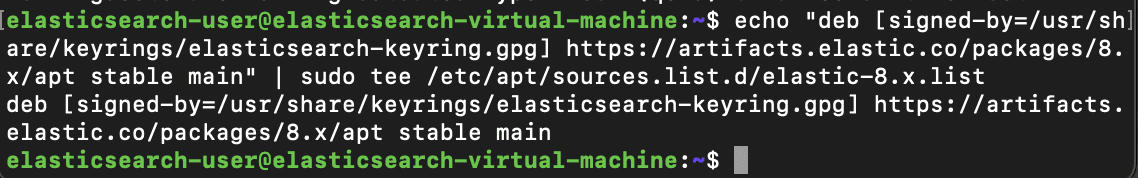
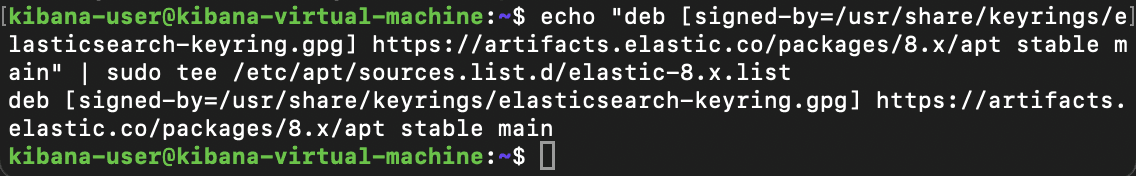
echo "deb [signed-by=/usr/share/keyrings/elasticsearch-keyring.gpg] https://artifacts.elastic.co/packages/8.x/apt stable main" | sudo tee /etc/apt/sources.list.d/elastic-8.x.listdeb [signed-by=/usr/share/keyrings/elasticsearch-keyring.gpg] https://artifacts.elastic.co/packages/8.x/apt stable main
Finally, we'll update our package manager and install Elasticsearch with
sudo apt update && sudo apt install elasticsearch
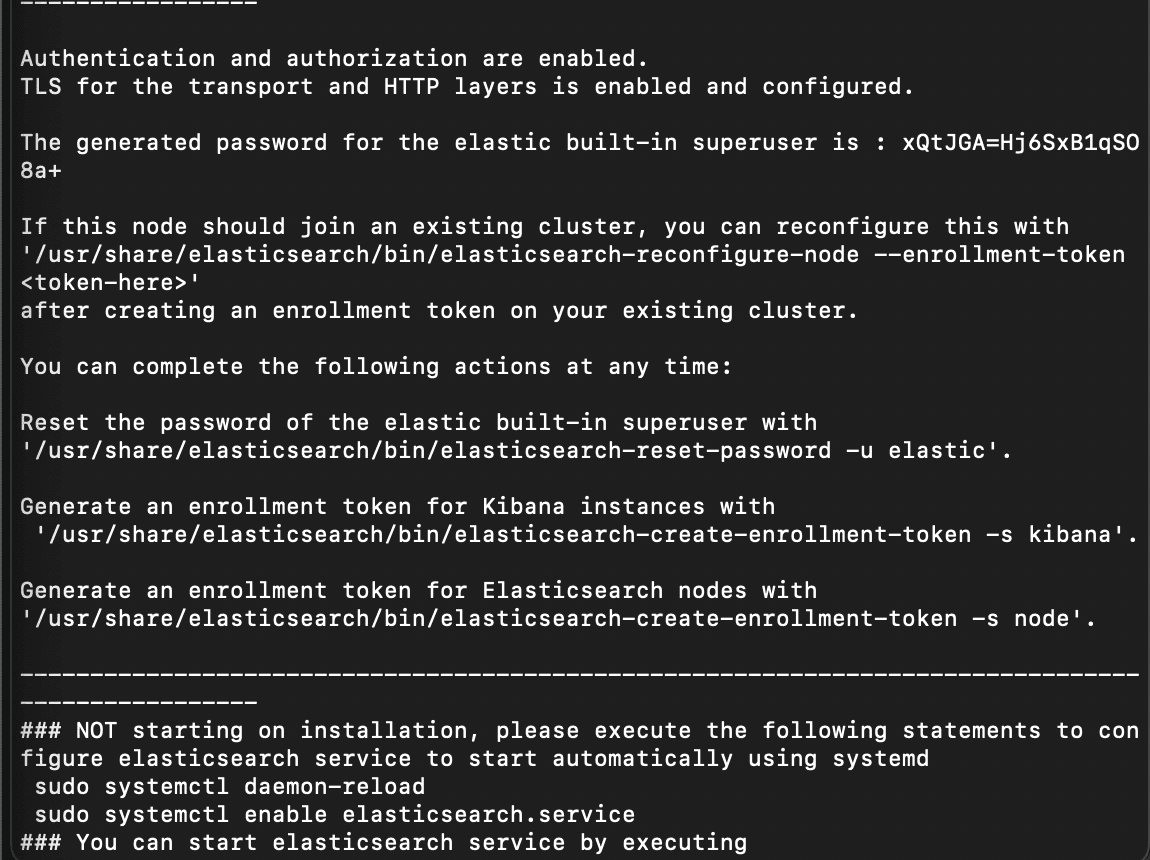
After installation, we will see all the default generated values from Elasticsearch, including the generated password for the built-in elastic super-user, as well as information for how to reset the password and generate enrollment tokens for other ES nodes and Kibana
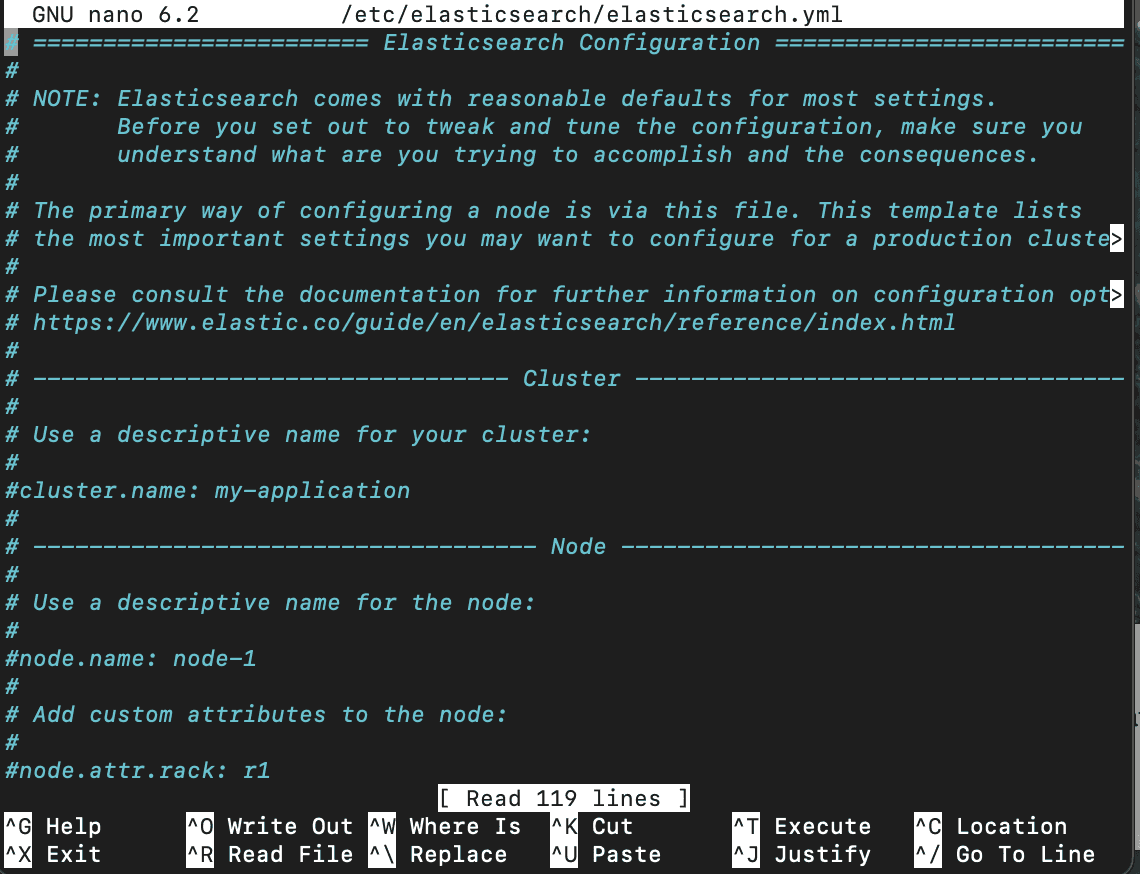
Next, we'll want to make configuration changes to Elasticsearch itself, and to do that, we'll access the /etc/elasticsearch/elasticsearch.yml file.
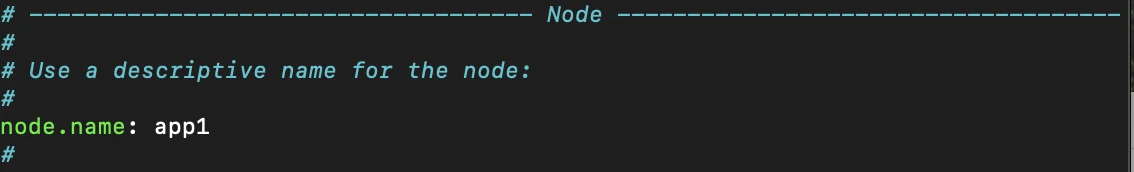
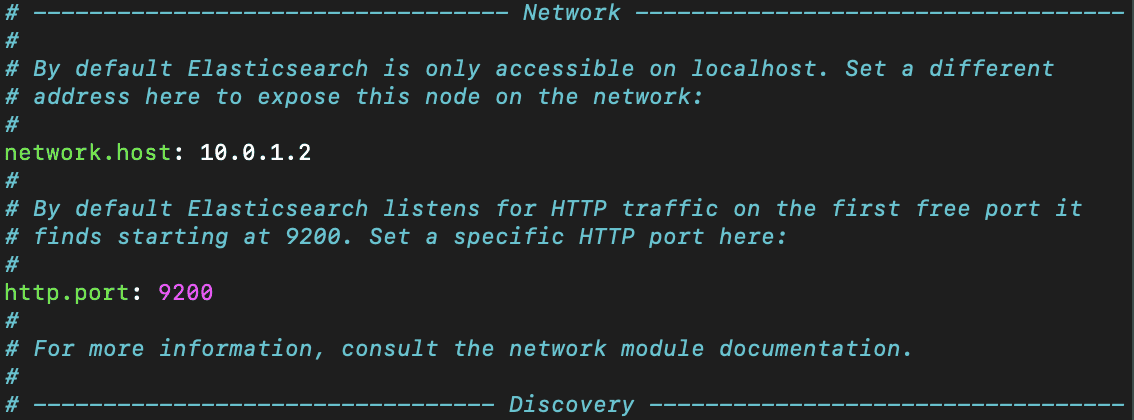
From here, we'll want to make a few changes, firstly to the node.name value, where we will uncomment and name the node, in this case, we'll name it app1, the network.host value, where elasticsearch will be hosted, which we'll use the IP address of our VM (10.0.1.2) and we'll uncomment the line with http.port for good measure. We'll then close the configuration file and save our changes.

III. Kibana Deployment
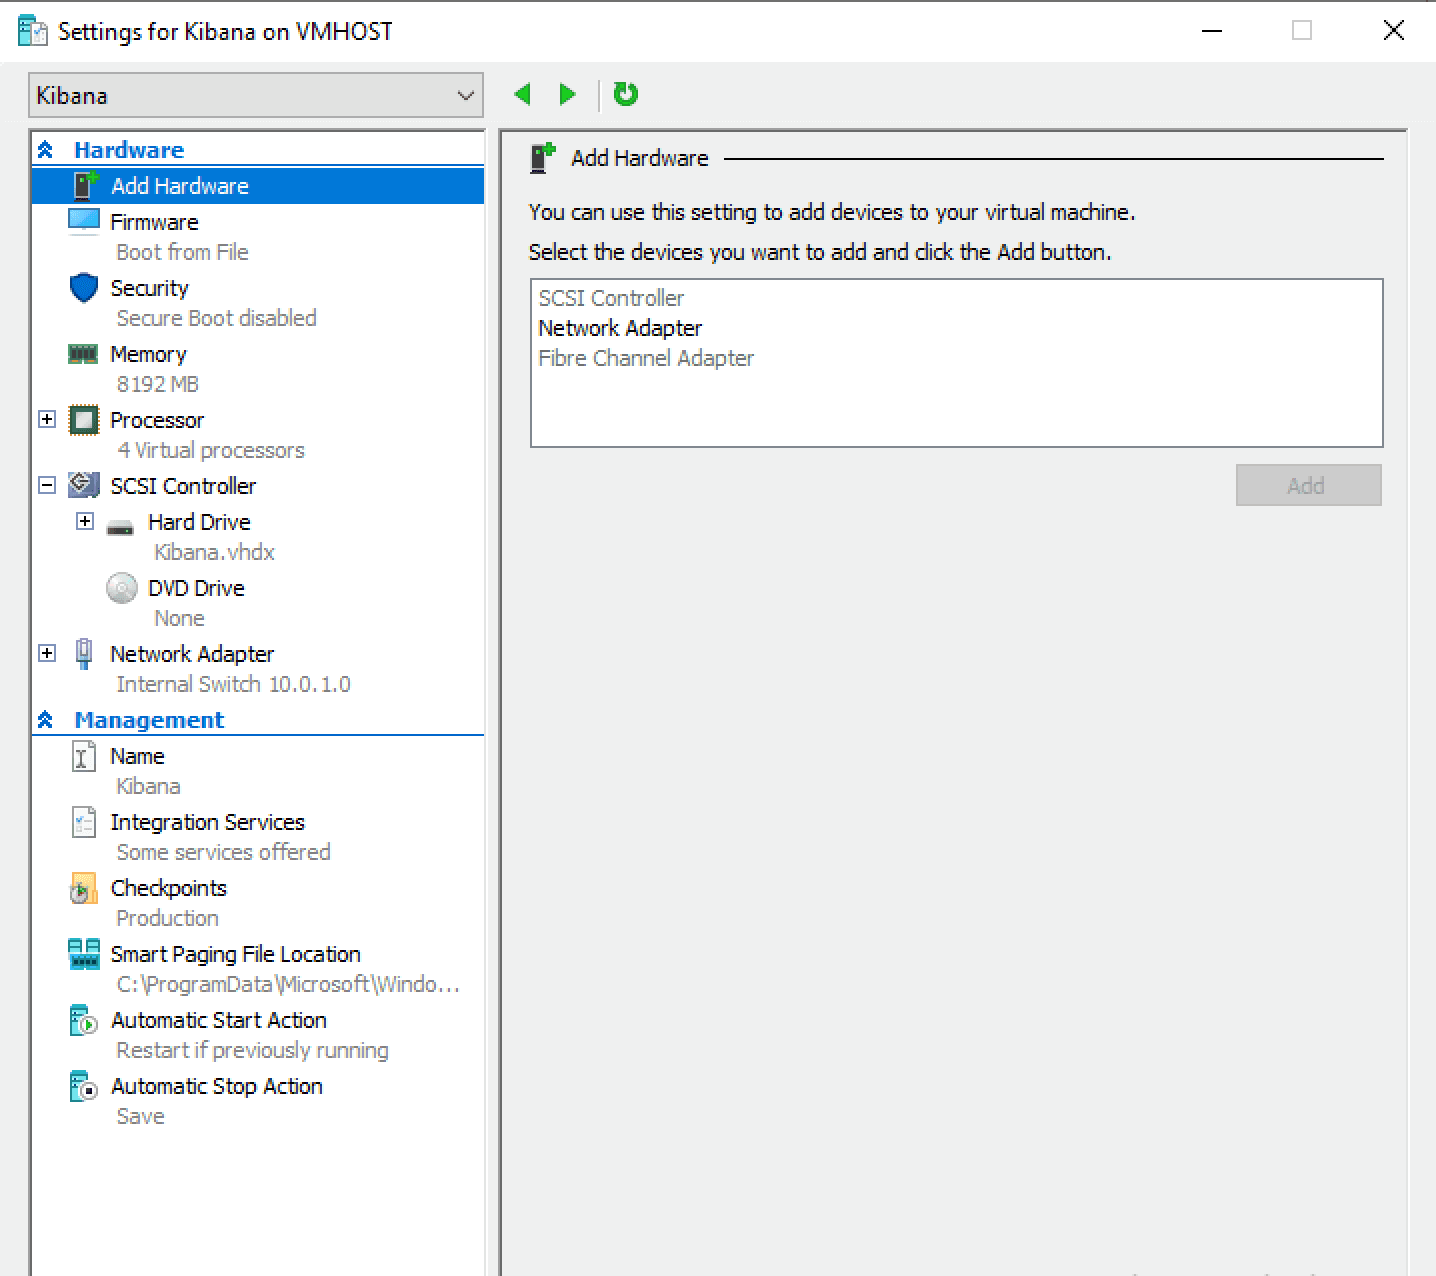
As with the previous Ubuntu-based VMs, we'll disable Secureboot and deploy 4vCPUs.
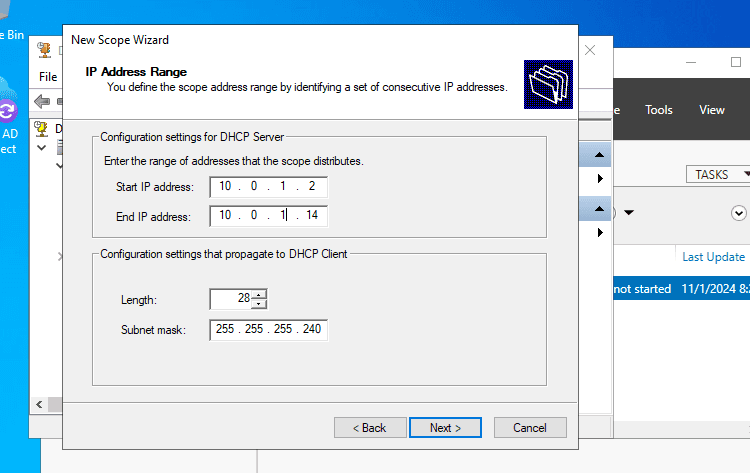
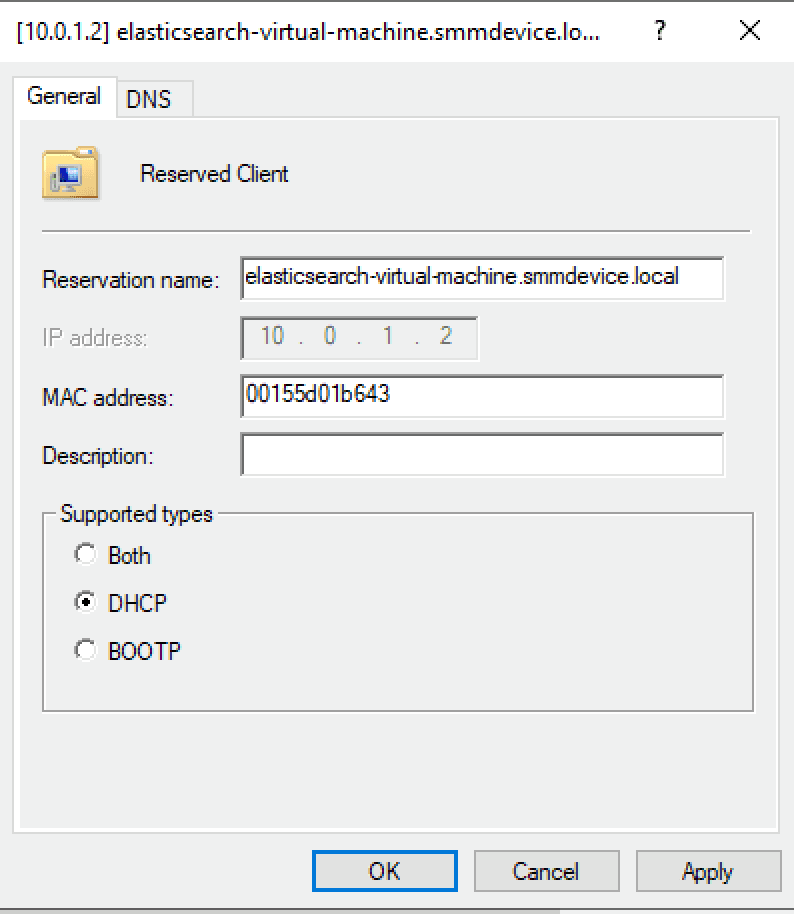
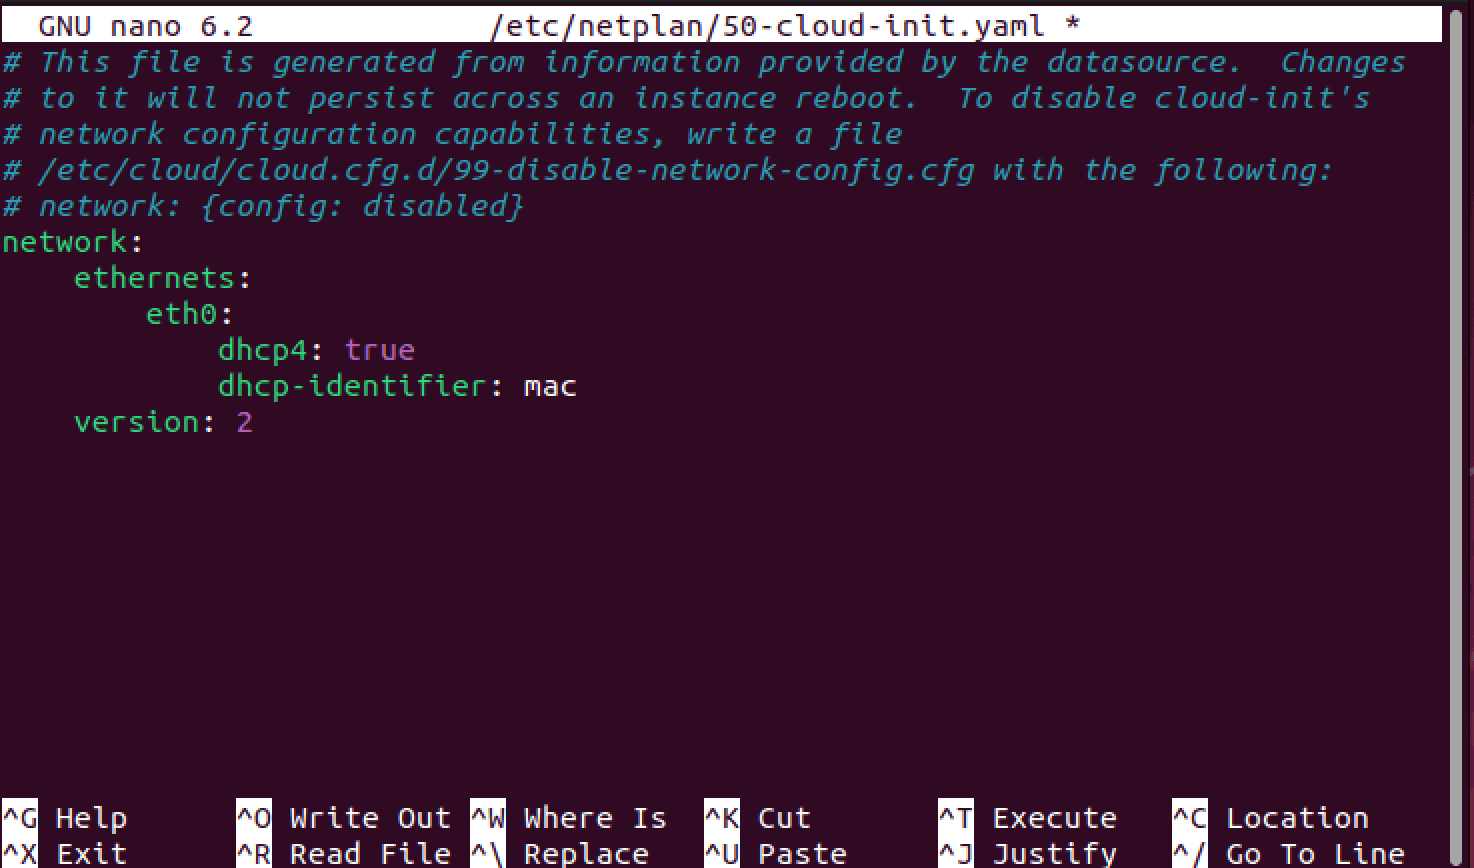
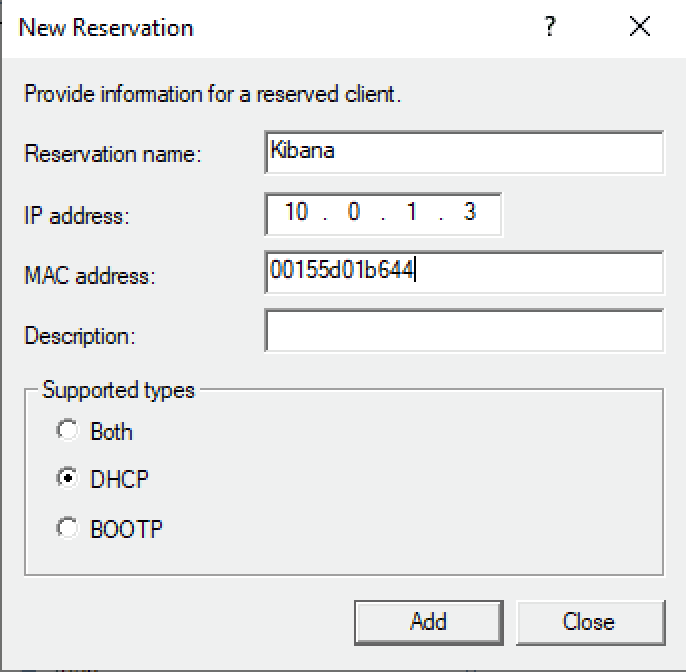
Next, we'll log onto our DHCP server and set a new DHCP MAC-based reservation for the Kibana machine.
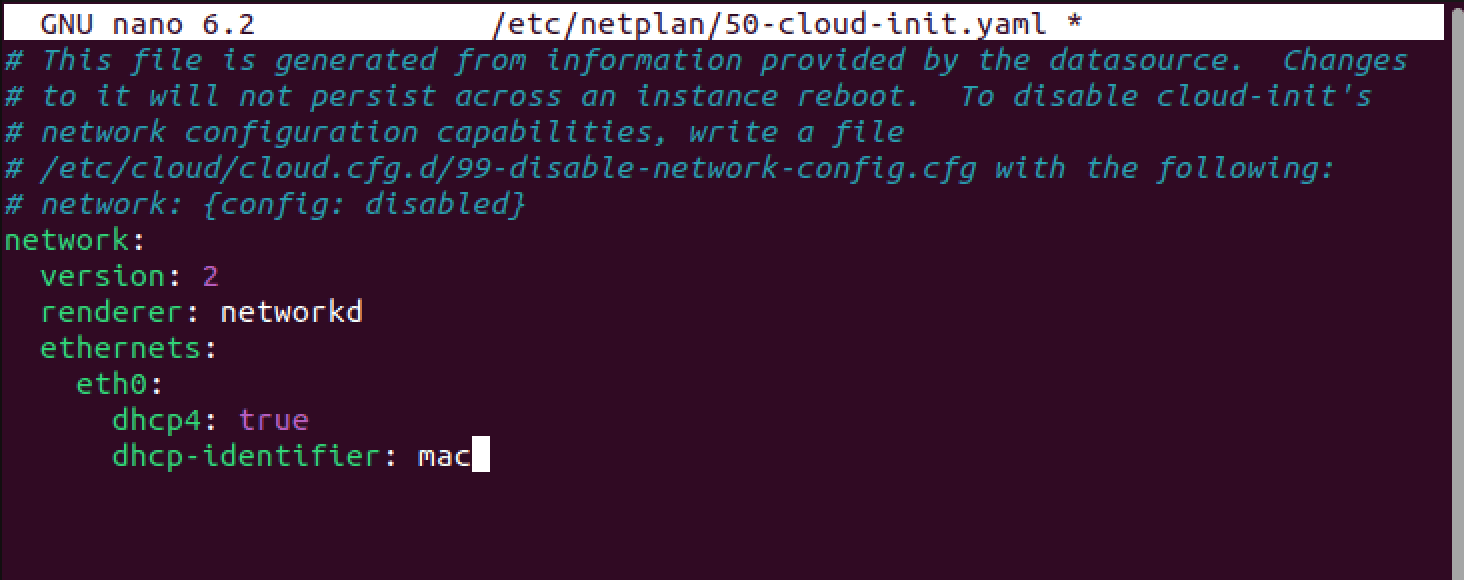
We'll then adjust the Netplan configuration on the Kibana machine to utilize the DHCP reservation set at the server
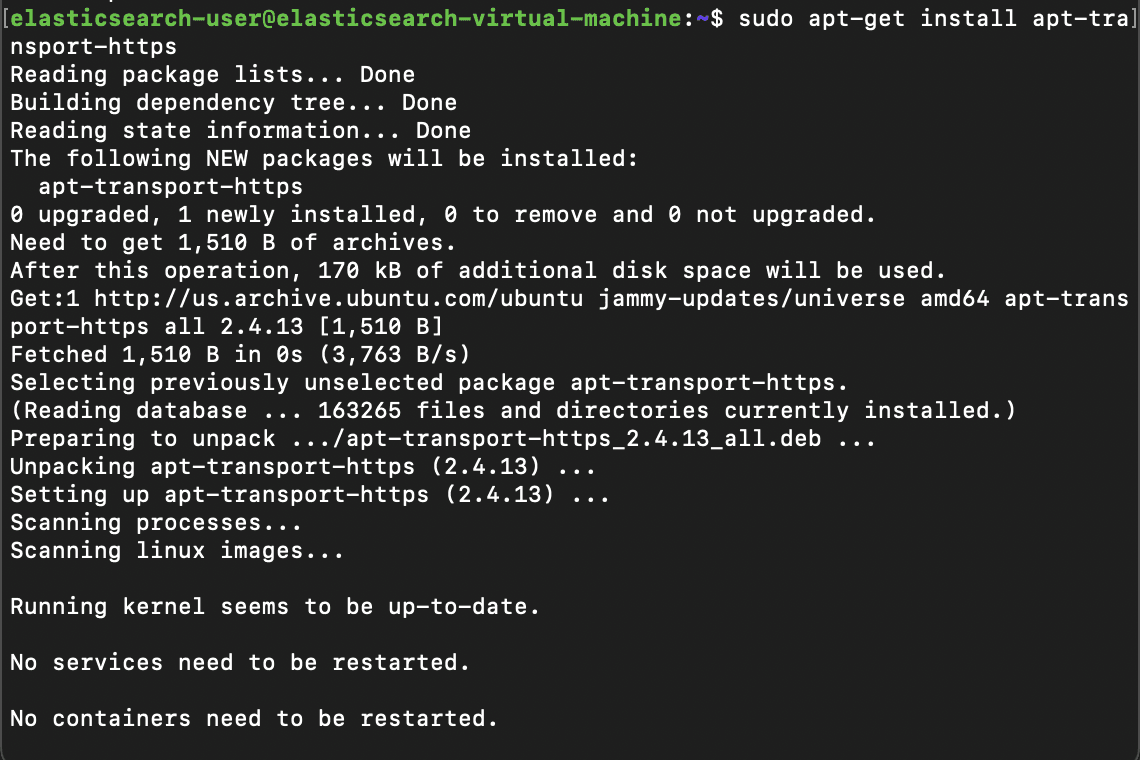
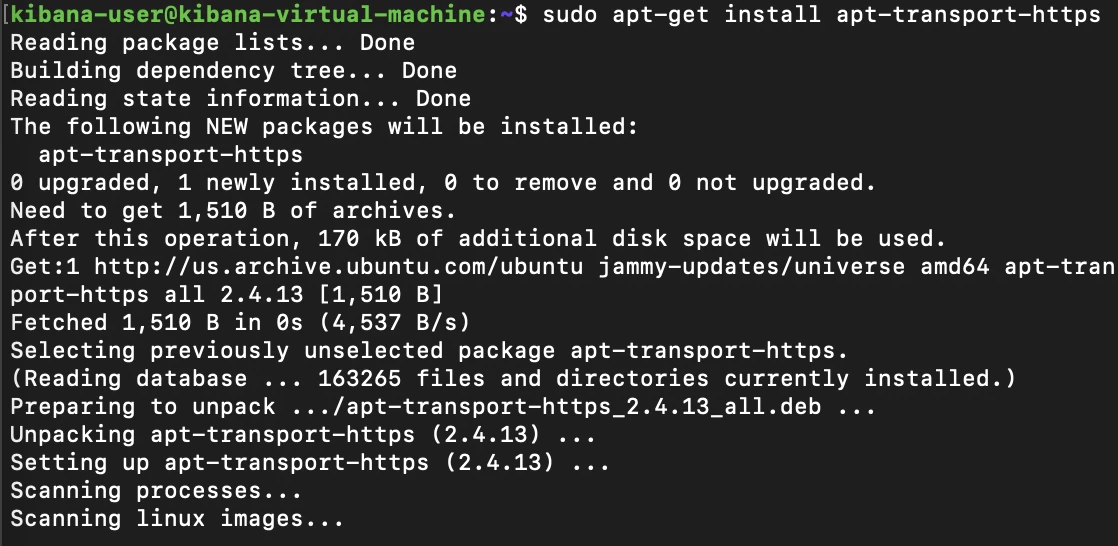
Next, also similar to before, we'll install the apt-transport-https dependency with by running the command:
After this, as before, we can import the Elastic repository to our /etc/apt/sources.list.d directory which will include our package to install Kibana
Next we'll run sudo apt update && sudo apt upgrade && sudo apt-get install kibana
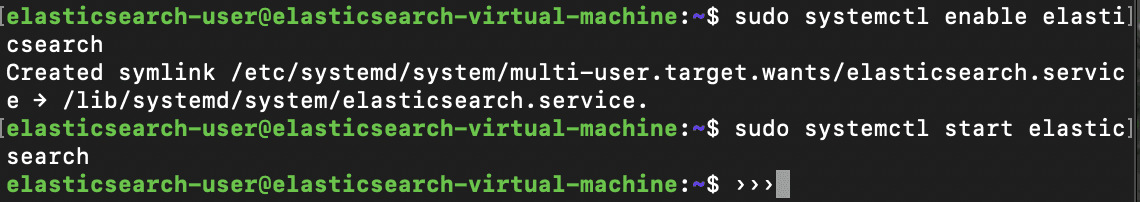
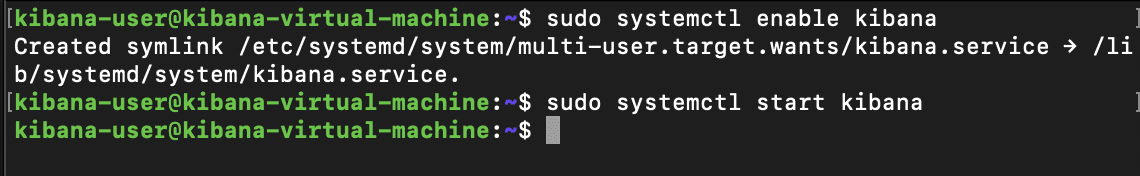
And after installing, we'll enable and start the service
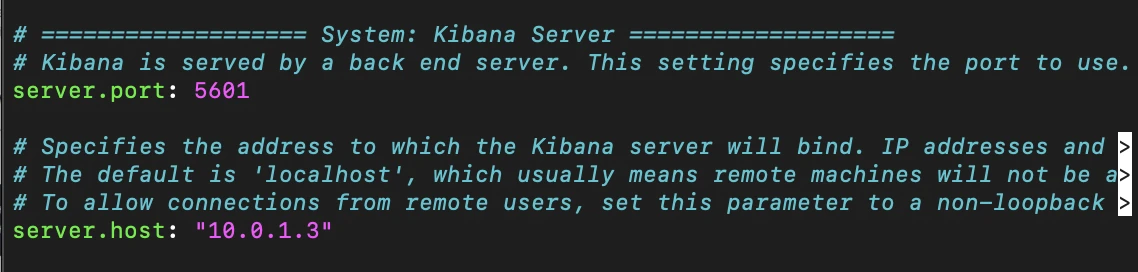
Once installed, just as with Elasticsearch, we have some additional configurations to make to the /etc/kibana/kibana.yml file.
These will include:
Specifying a server.port value of 5601
Setting server.host to our Kibana machine's address (10.0.1.3)
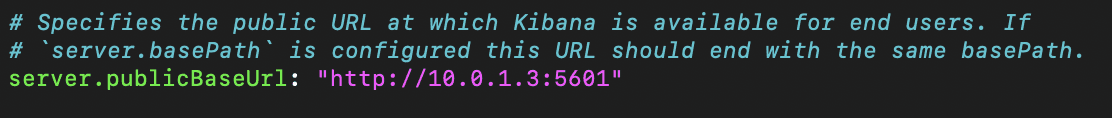
Setting the server.publicbaseurl to the URL that we will use to access Kibana from the web browser
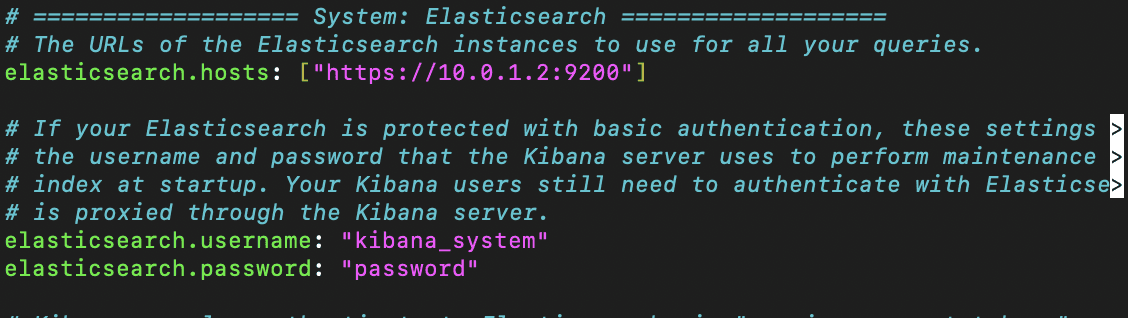
Setting our elasticsearch.password to 'password' (but leaving elasticsearch.username to default value
Setting elasticsearch.hosts to the IP address and port number of our elasticsearch machine
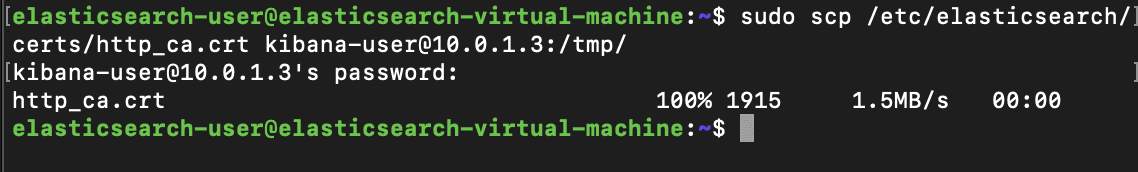
Specifying the CA of elasticsearch by setting the elasticsearch.certificateauthorities value to the root CA file generated during the initial security configuration during the our installation of ES to the directory of /etc/kibana/certs/http_ca.crt
(We will SCP this file to this directory after configurations have been made)

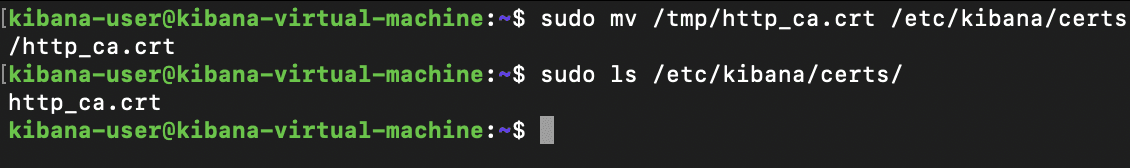
Now we will need to create a directory to house the Root CA file so that we can establish trust between our Elasticsearch Cluster and Kibana

Next, we'll just need to place the http_ca.crt Root CA file into the /etc/kibana/certs directory so that Kibana can find the file as specified in its kibana.yml configuration.
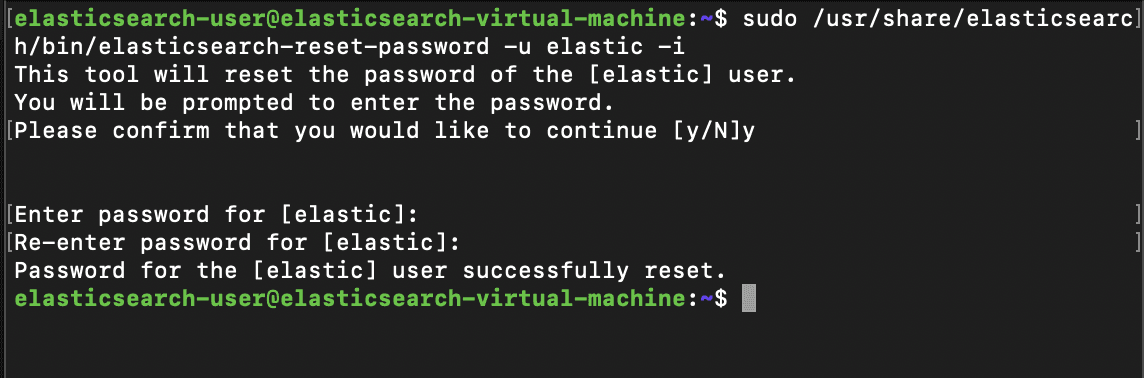
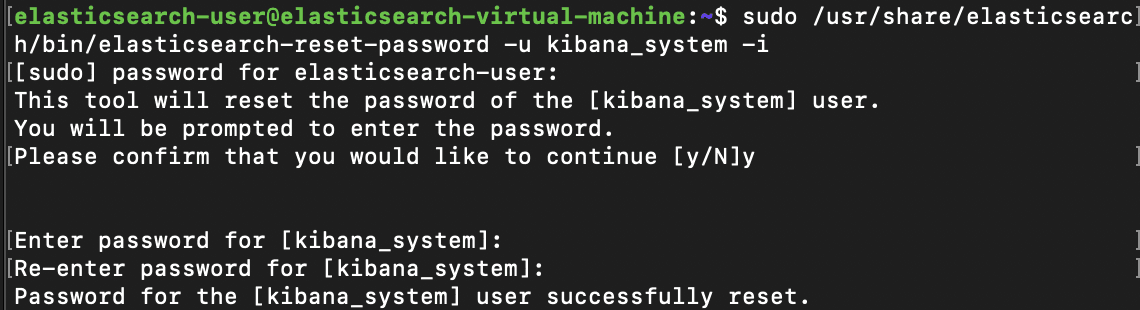
Initial certificate and hosting configurations should now be finalized and we can now setup the kibana_system account's new password to match the one in kibana.yml. Kibana will use this account to connect and communicate with Elasticsearch.
We can begin by connecting back to the Elasticsearch machine and utilizing the /usr/share/elasticsearch/bin/elasticsearch-reset-password utility once again, except this time by specifying kibana_system as the user.
Next we'll want to allow communication over tcp/5601 within ufw
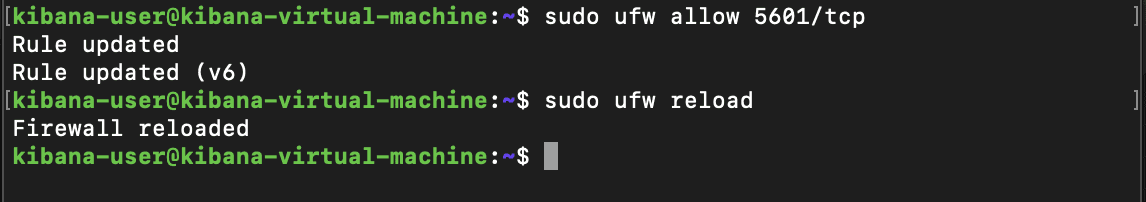
Finally we can reboot kibana and access it in the web browser after it starts up at the specified address and port
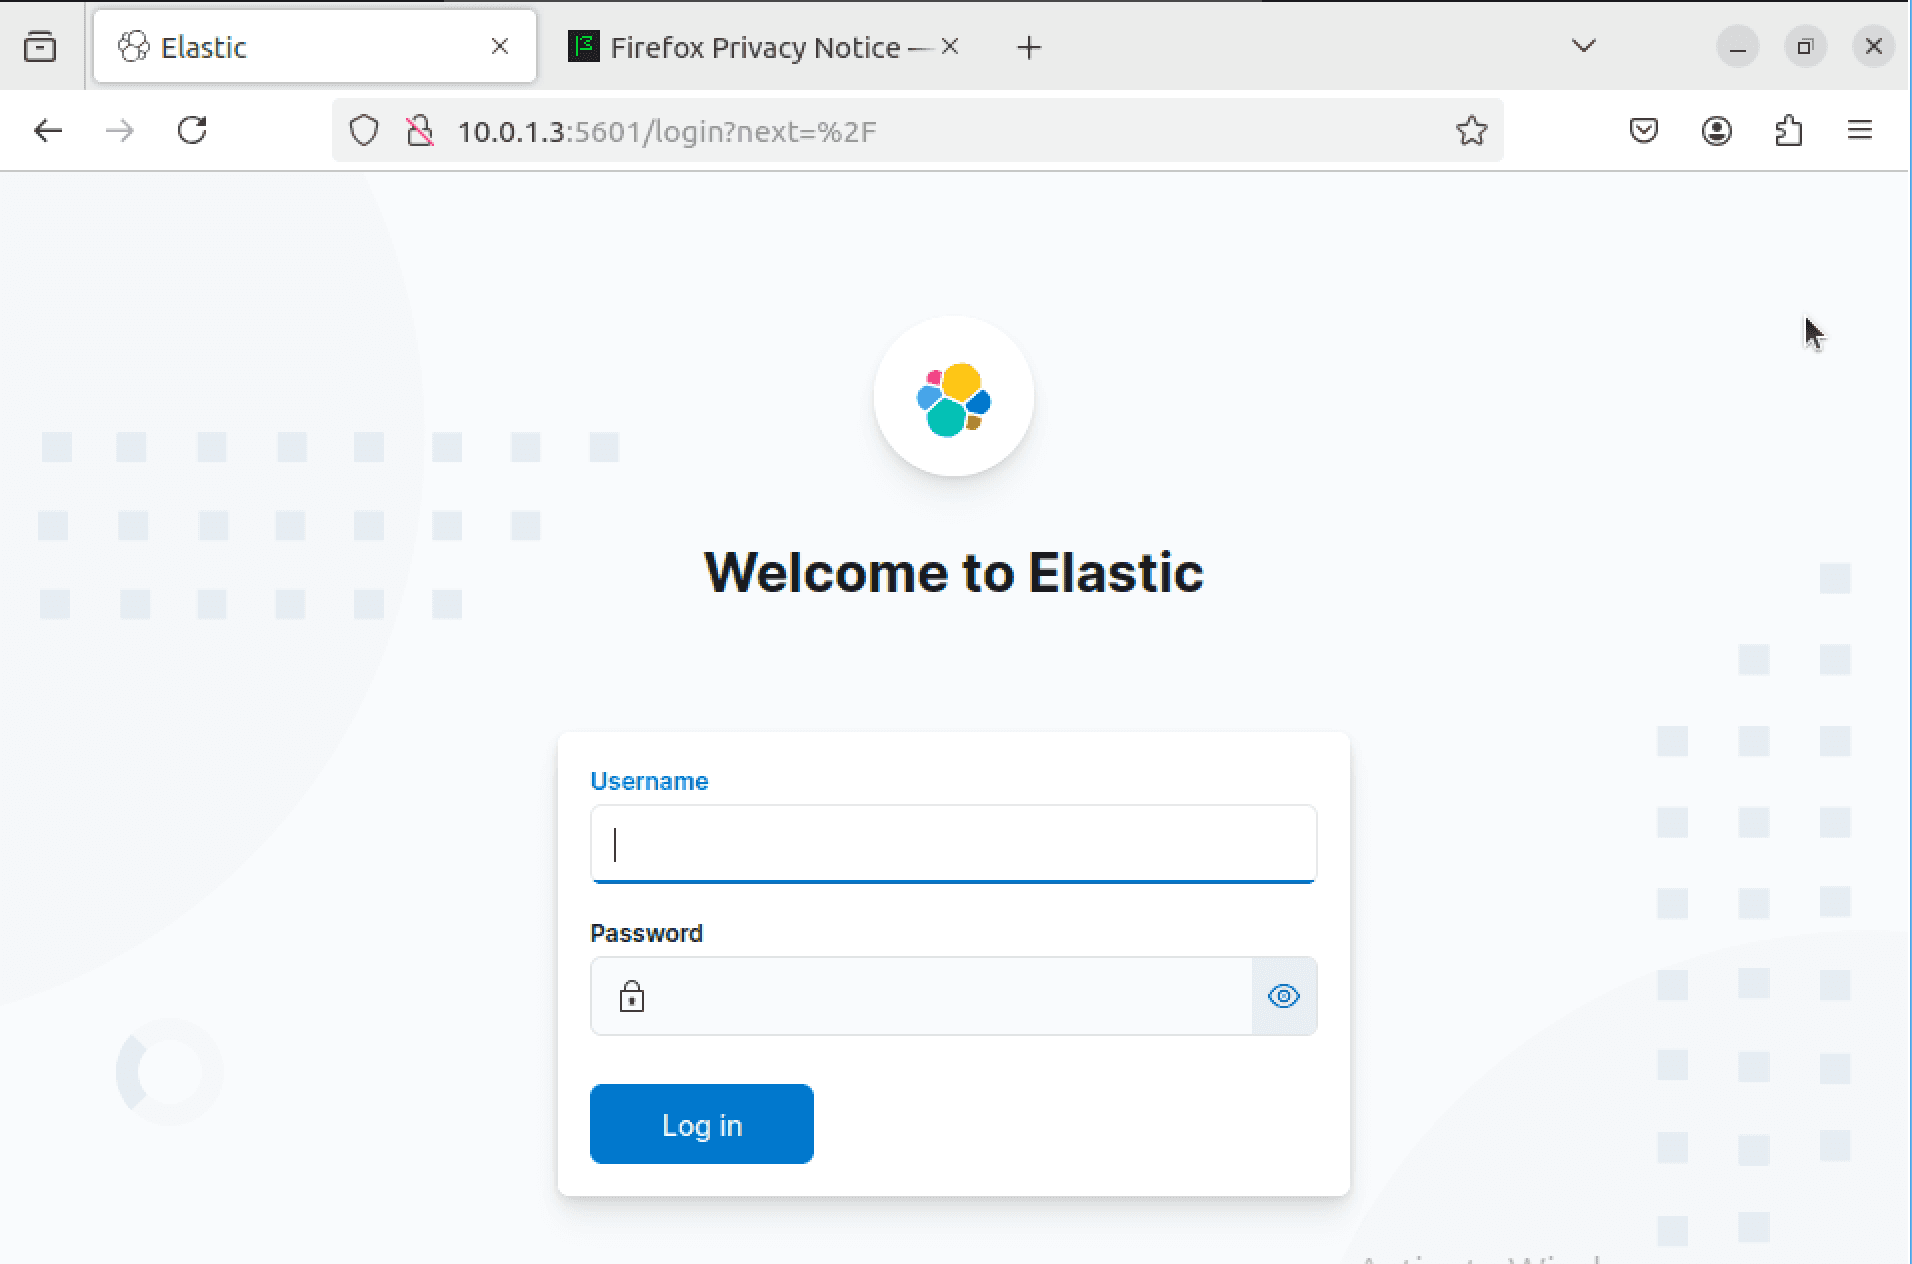
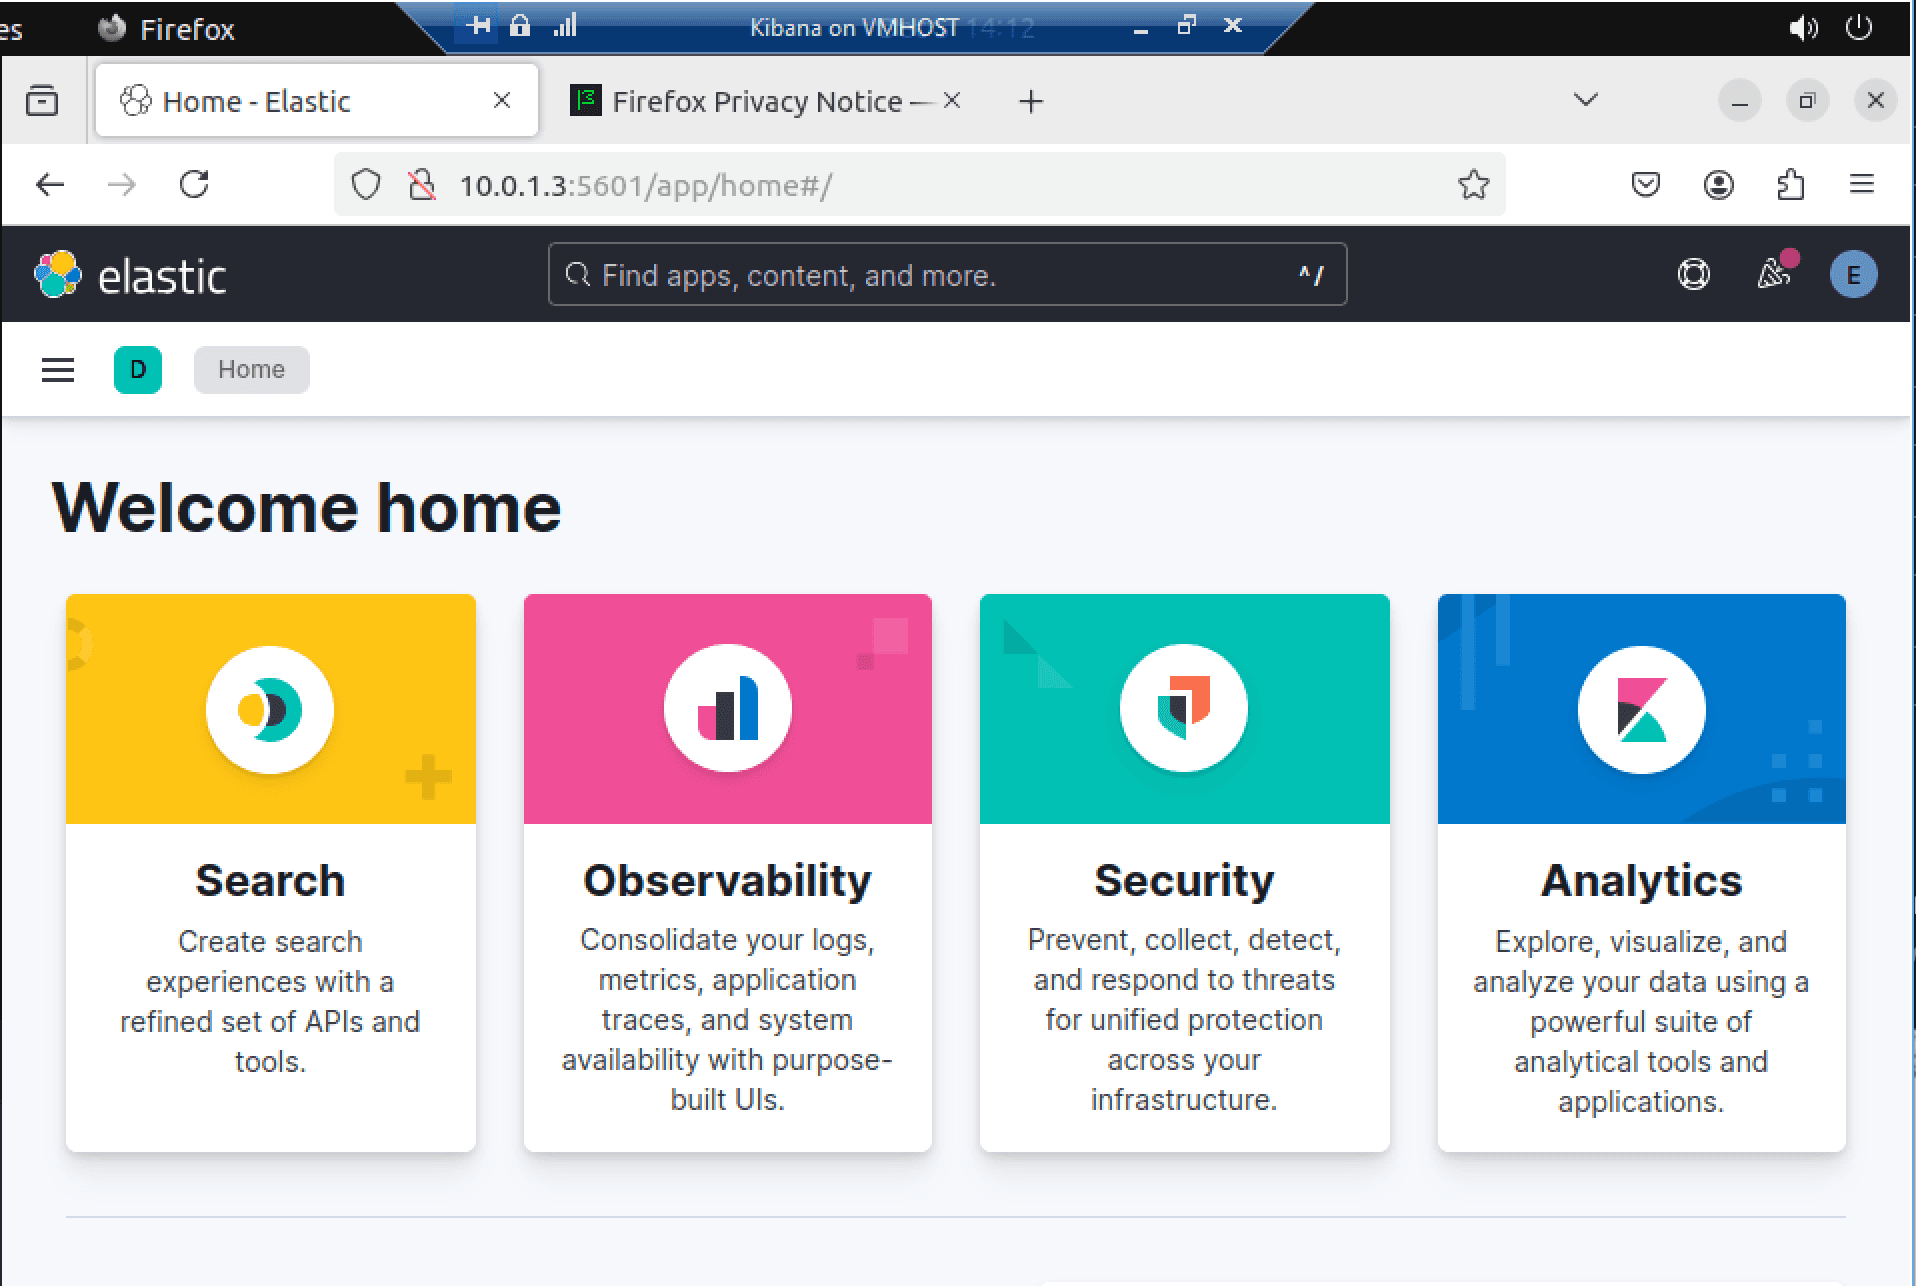
Finally, we can logon using the elastic super-user account to see the Kibana dashboard
IV: Securing the ElasticStack
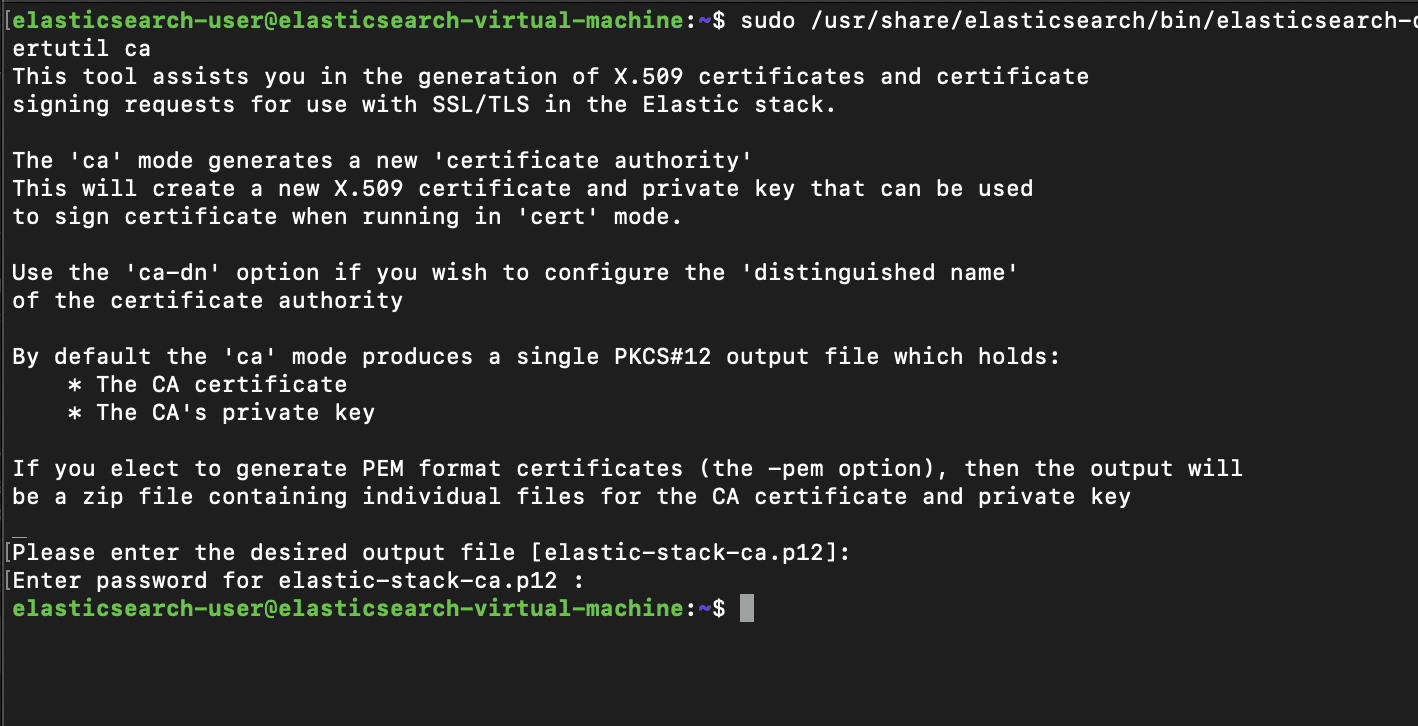
In this section we'll begin securing the inter-node communication between the nodes in order to allow TLS in our configuration. To begin, we'll need to create a certificate authority to distribute certs throughout the stack. We can begin by running elasticsearch-certutil in ca mode, and setting a password for the new ca file
To do this, we will access the /usr/share/elasticsearch/bin/elasticsearch-certutil
utility, and we will run it in ca mode
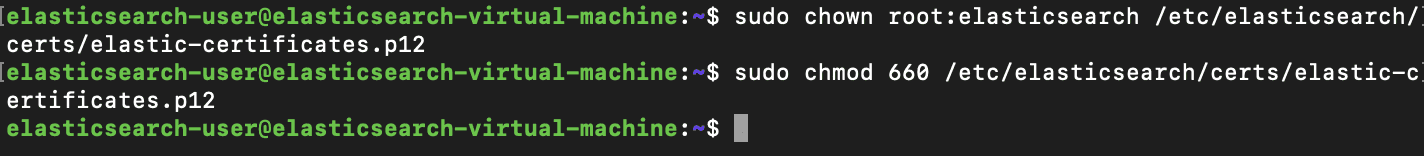
Next, we'll copy our newly-generated certificate file into our certs folder, inside our Elasticsearch certificates directory.

To make sure that elasticsearch can access the certificate file correctly, we'll change the owner to the elasticsearch group, and set permissions for the elastic-certificates.p12 file to the same as the created by default certificate files created during Elasticsearch's setup
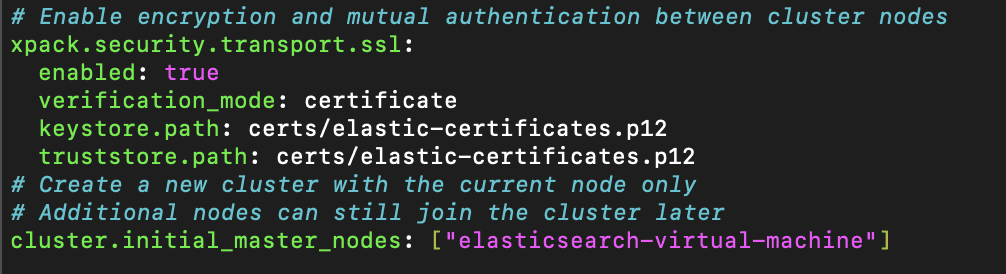
We'll next need to configure the paths used for Elasticsearch's keystore and truststore in the elasticsearch.yml file. We'll change these to access the elastic-certificates.p12 file, then save and close the file.
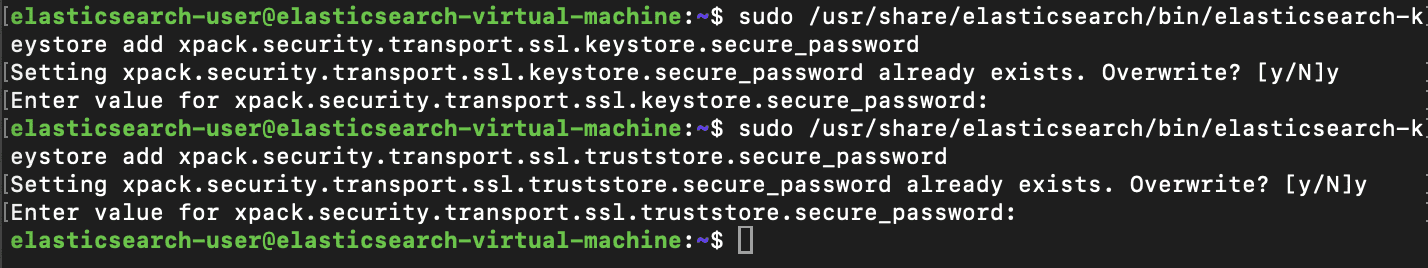
Next, since we've set passwords for our certificate, Elasticsearch will need said password for accessing the .p12 file. To provide this in a secure way without plainly placing it directly into the .yml file in plaintext, we can add the certificate password as entries into Elasticsearch's keystore.
To begin, we'll access the elasticsearch keystore utility located in /usr/share/elasticsearch/bin/elasticsearch-keystore, where we will add:
The secure configuration used thus far should be sufficient to secure traffic between nodes, and we'll now shift our focus to securing https traffic. To start, we'll need to stop both Kibana and Elasticsearch services
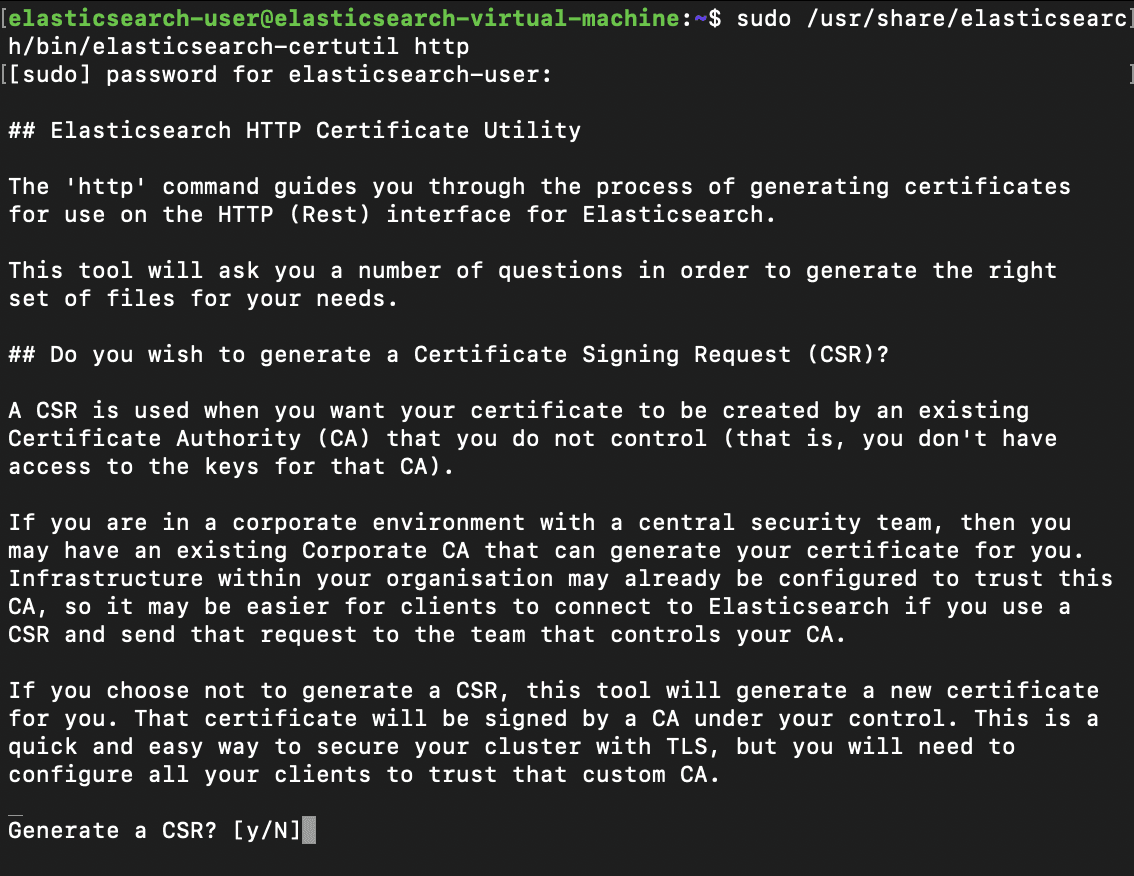
After both services are stopped, we'll need to use the elasticsearch-certutility once again in http mode. During certificate creation, we'll use the following options for the requested input fields:
Generate a CSR? N
Use an existing CA? Y
For how long should the certificate be valid? 5y
Do you wish to generate one certificate per node? Y
Node #1 Name: appl
Which hostnames will be used to connect to appl? Elasticsearch-virtual-machine
Which IP address will be used to connect to appl? 10.0.1.2
Specify a password for the http.p12 file ——
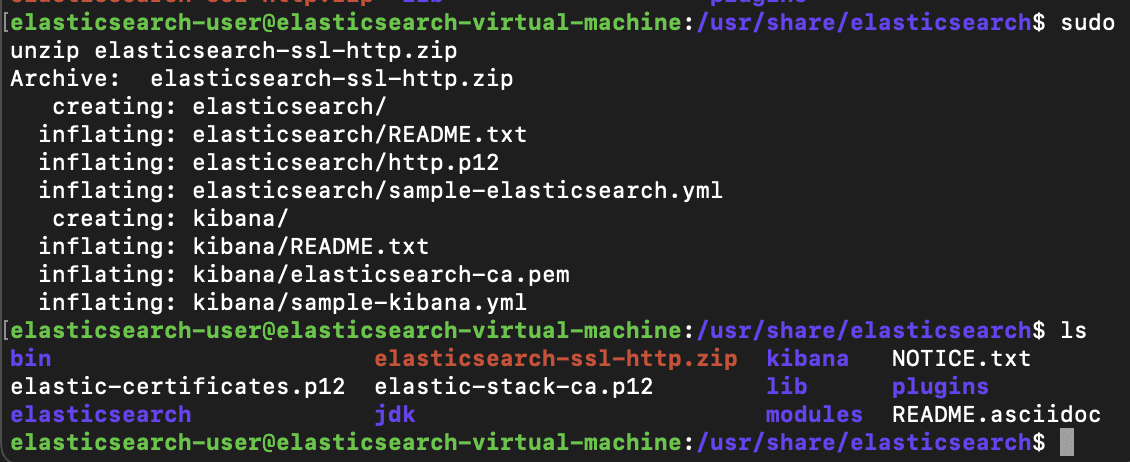
Now that the cert-bundle is created, we'll cd into our /usr/share/elasticsearch directory and unzip the newly created elasticsearch-ssl-http.zip file
After unzipping, we can list the contents of the unzipped elasticsearch directory to find the http.p12 certificate, a backup configuration file, and a readme.txt file. Before moving this into our certs folder, we'll need to rename the pre-existing http.p12 file already present inside the folder to http.p12.old, then proceed to move the new http.p12 file into that directory to take its place.
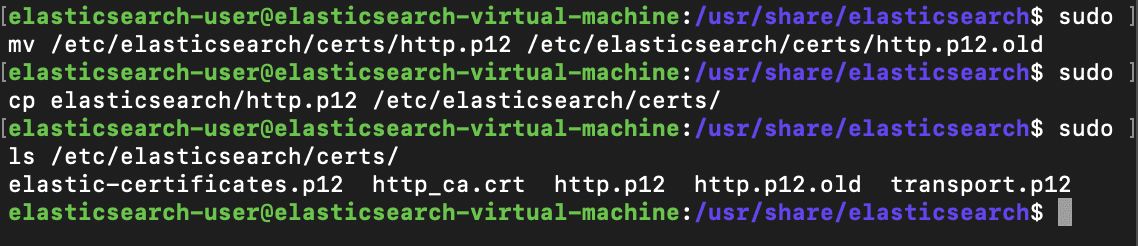
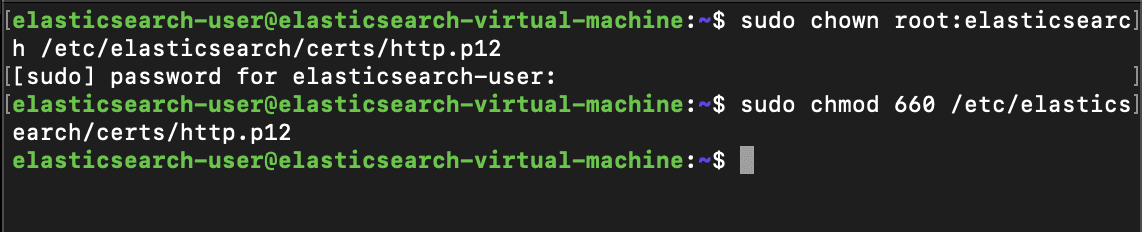
Now that the new certificate file is in place, we'll want to set permissions and ownership of the new http.p12 file to match that of the certificate files created during the security configuration performed at install.
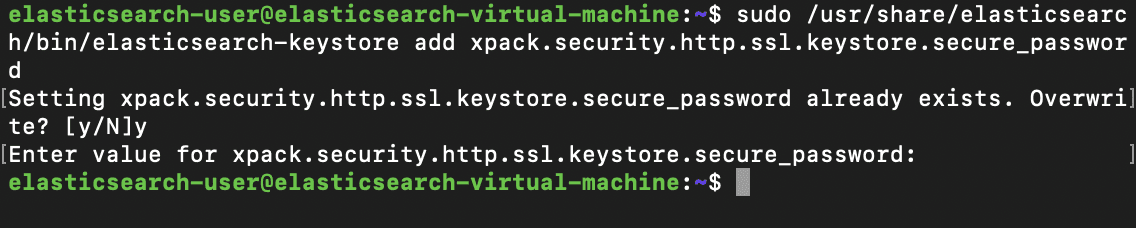
Now, just like for the transport security password, we'll add our http.ssl.keystore passwords to the elasticsearch keystore by once again, using the elasticsearch-keystore utility.
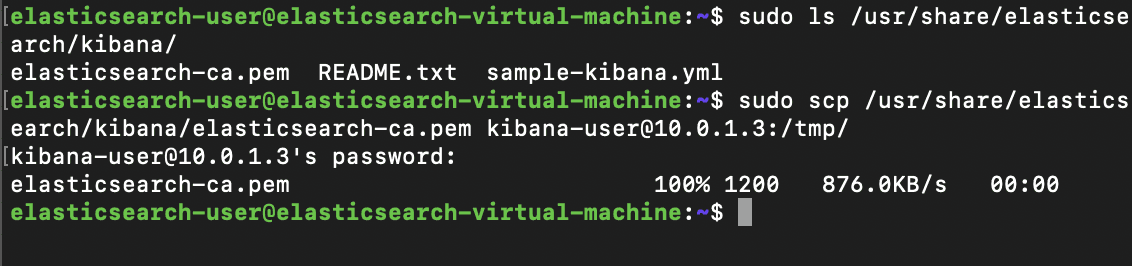
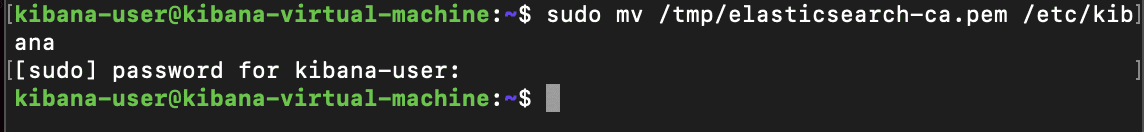
This should be all the security configuration needed for the elasticsearch node, and now we should can begin securing Kibana to ensure that we are able to access the web interface using https. Firstly, we'll return to our /usr/share/elasticsearch directory to find the unzipped kibana folder where we will find a elasticsearch-ca.pem file. We will then cp this file to Kiana's /tmp/ directory, and then into Kiana's configuration directory.
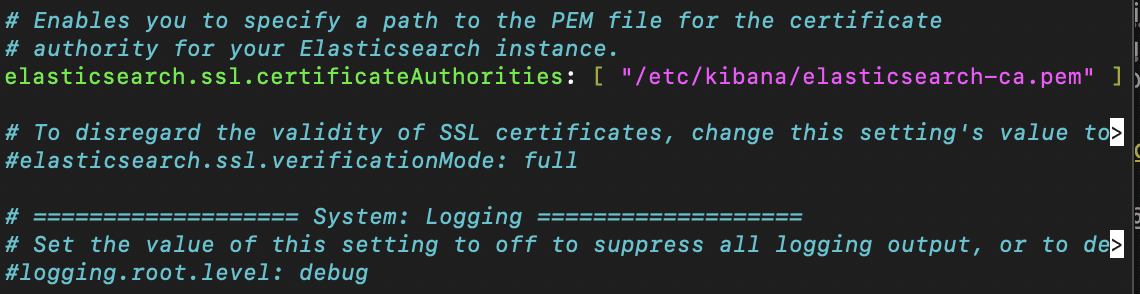
Now we'll access the kibana.yml file and specify the new Elasticsearch certficate authority
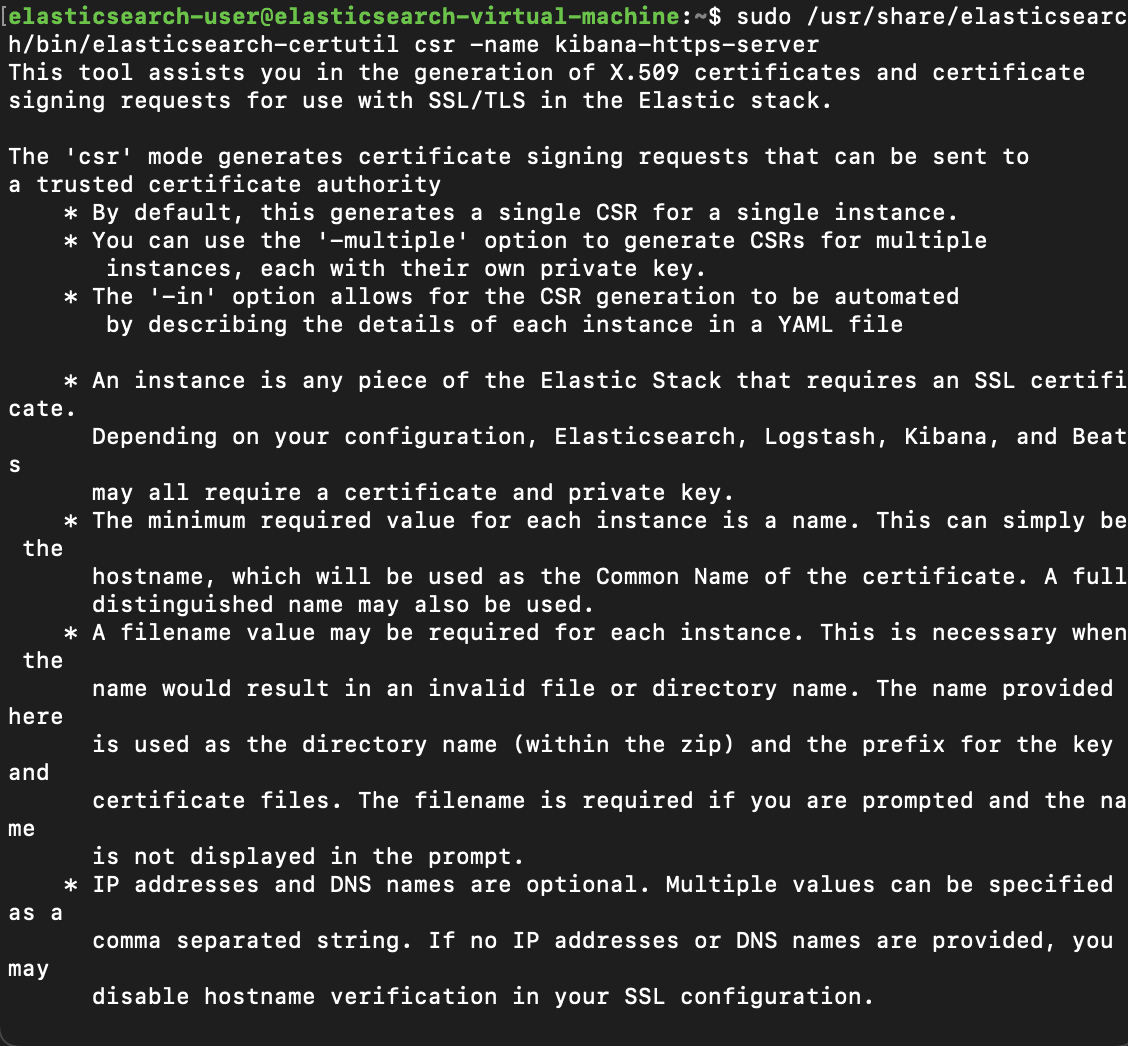
Finally, we can now begin the process of encrypting traffic between the browser and Kibana. We'll firstly need to generate a Certificate Signing Request (CSR). To begin this process, we'll log back on to our Elasticsearch VM and run the elasticsearch-certutil utility in CSR mode. When prompted, we'll allow the default name of csr-bundle.zip
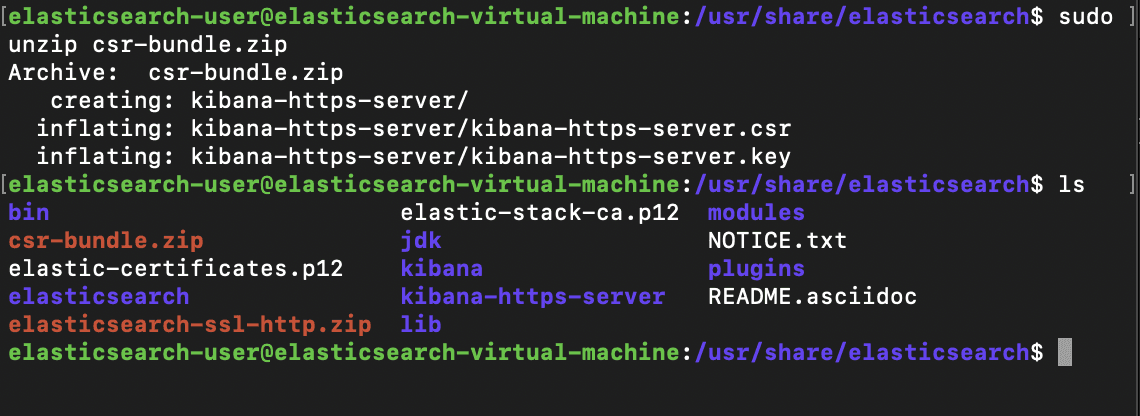
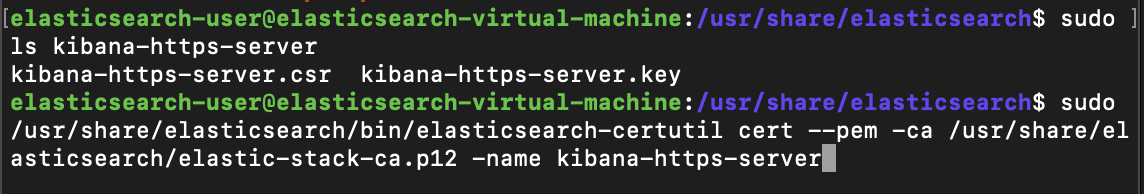
Now that the .zip file has been created, we'll unzip it and use the CSR in order to generate a certificate. Again, we will use the elasticsearch-certutil utility for this, and output the certificate in .pem format, which is usable with Kibana, verified by the elastic-stack-ca.p12 file.
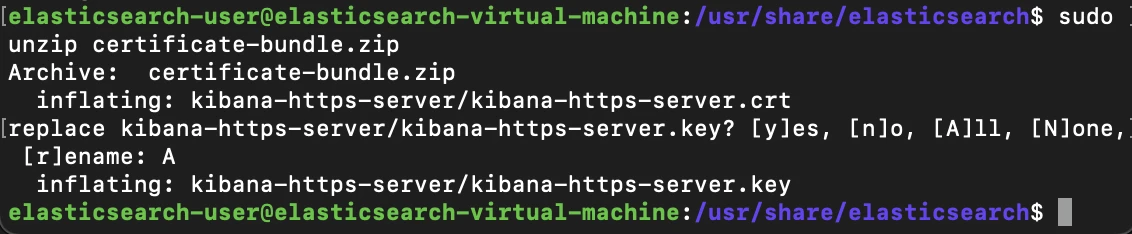
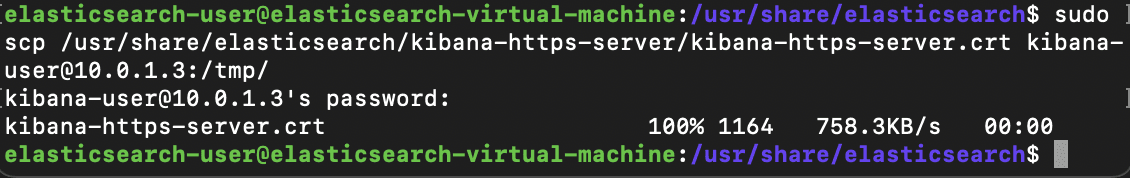
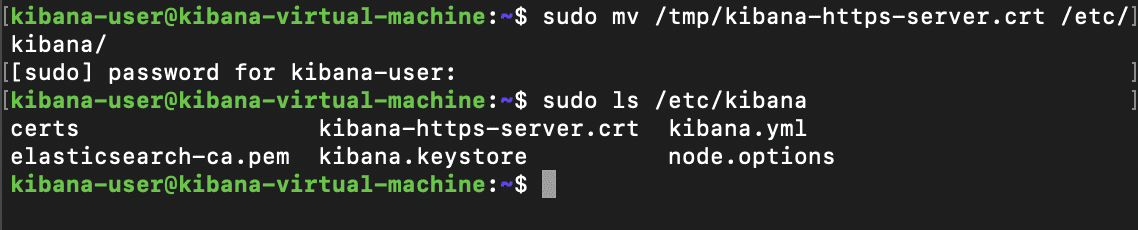
The previous command will result in the generation of the certificate bundle which will include our private key. We will unzip its contents. Within is a kibana-https-server.crt file that we will move to our Kibana machine's tmp directory, then into our configuration directory.
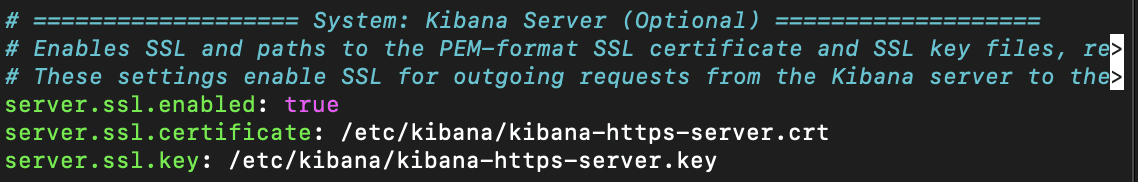
Now that both files are present in Kibana's configuration directory, we'll access the Kibana.yml file and make the following changes:
server.ssl.enabled: true
server.ssl.certificate: /etc/kibana/kibana-https-server.crt
server.ssl.key: /etc/kibana/kibana-https-server.key
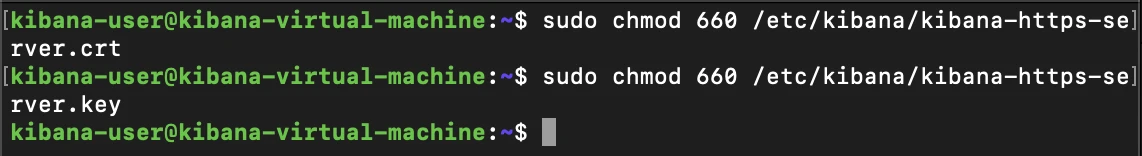
Finally, we'll change the permissions of both the .key and .crt files to allow for read-access by Kibana
Finally, after launching Kibana and logging in again with the elastic super-user, we can see that the certificate is recognized in the browser, and communication has been encrypted.
Now that Kibana and Elasticsearch are both connected and trusted, we'll begin deploying our Fleet server. This will be used to centrally manage our Elastic Agent services that will be deployed later.
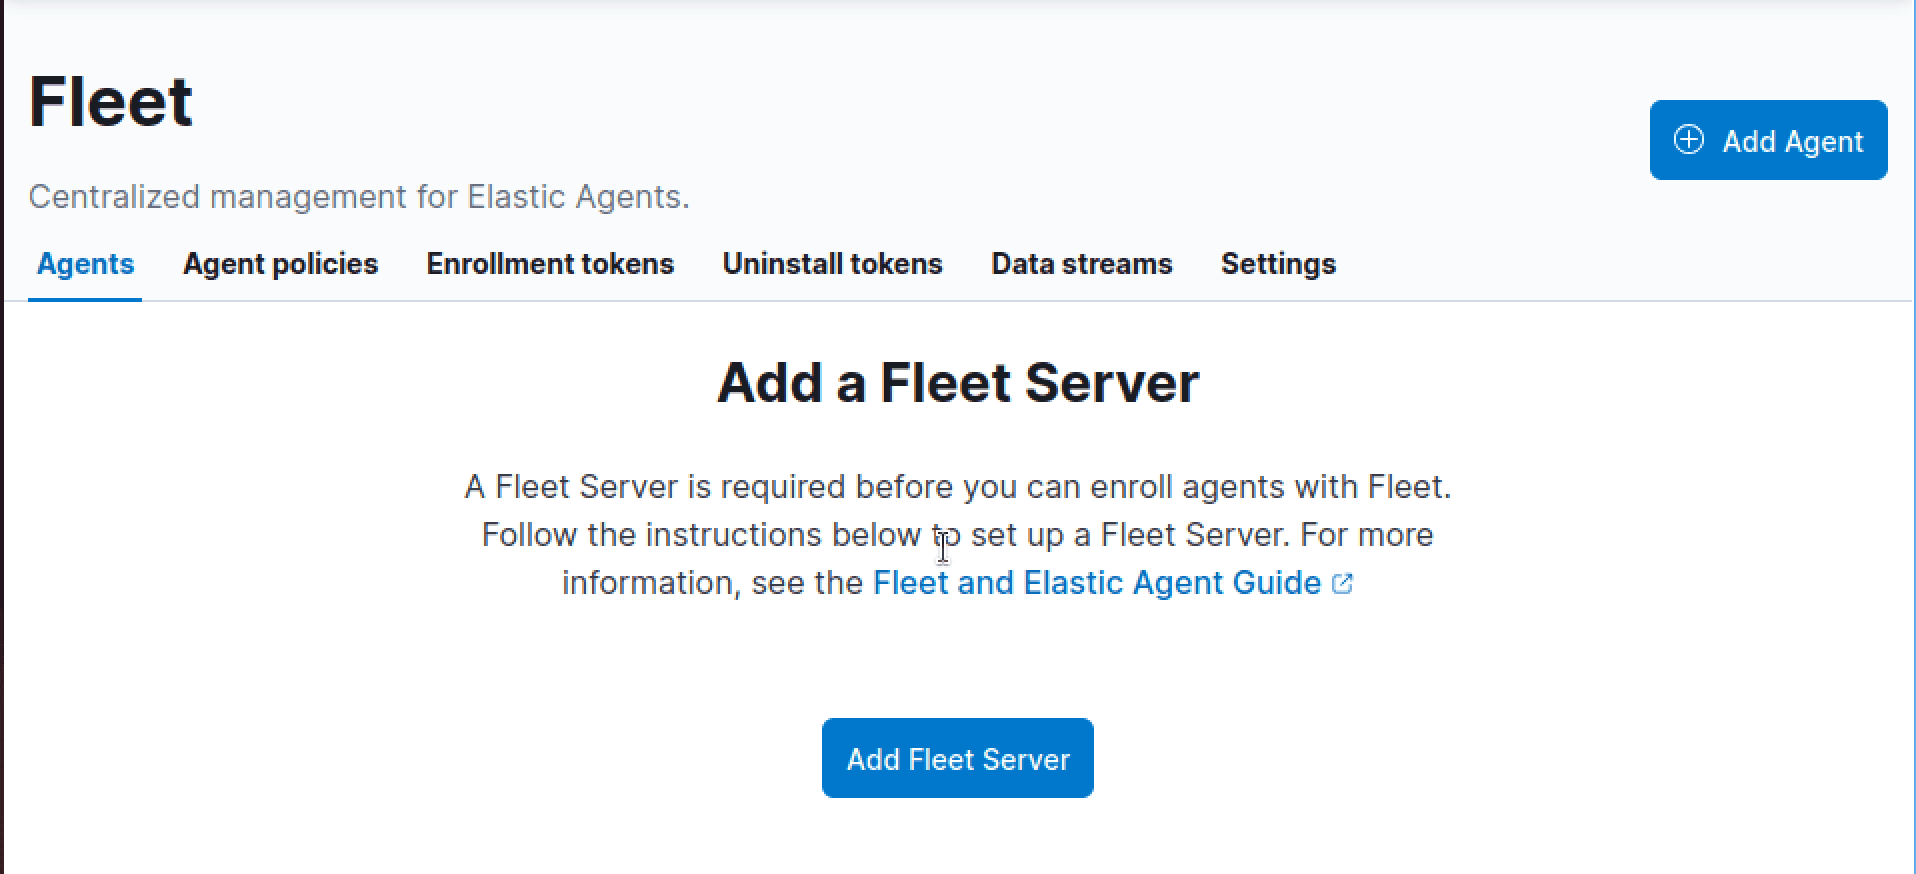
To start, we'll navigate to Management > Fleet > Add Fleet Server
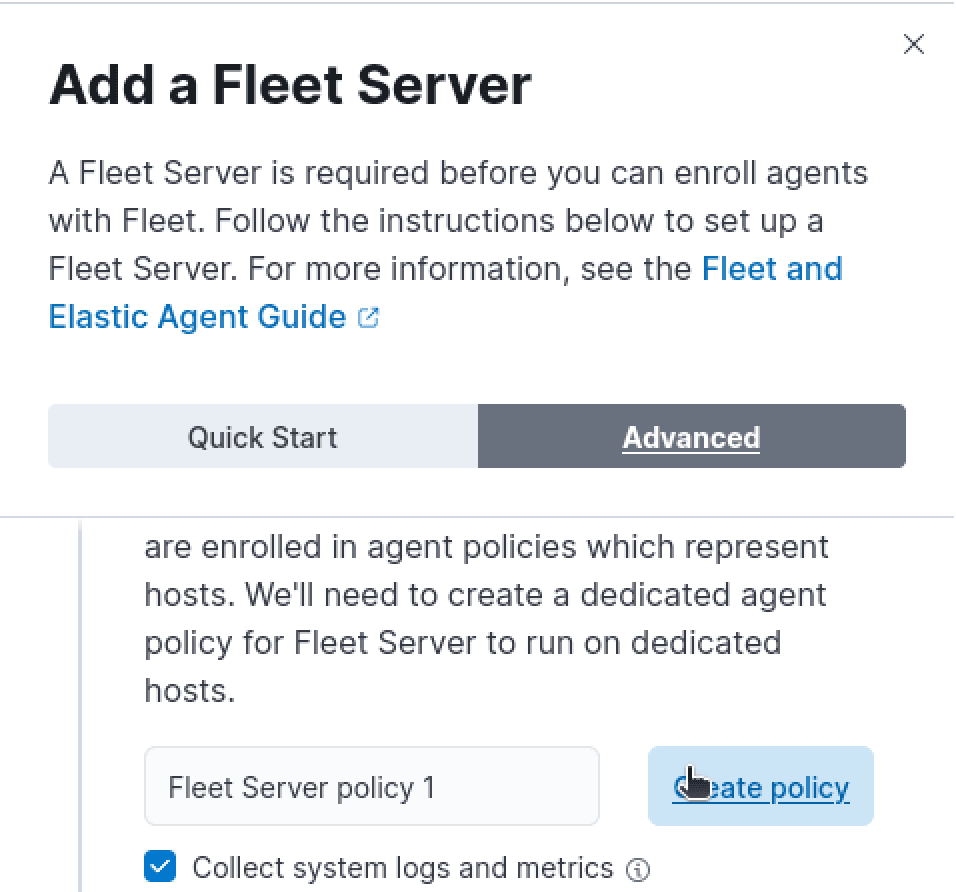
Next, we'll tab over to "Advanced" and create "Fleet Server policy 1"
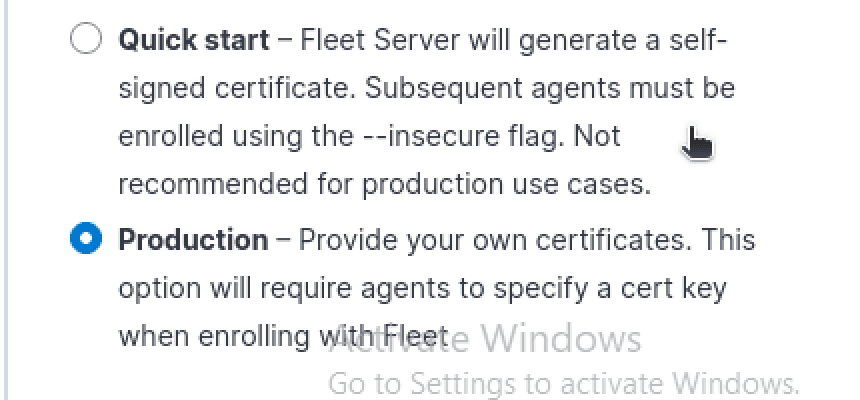
In the Advanced section, we'll select Production in order to provide the certificate that we've created earlier for Fleet to use to establish trust with deployed agents.
And we'll finalize the deployment.
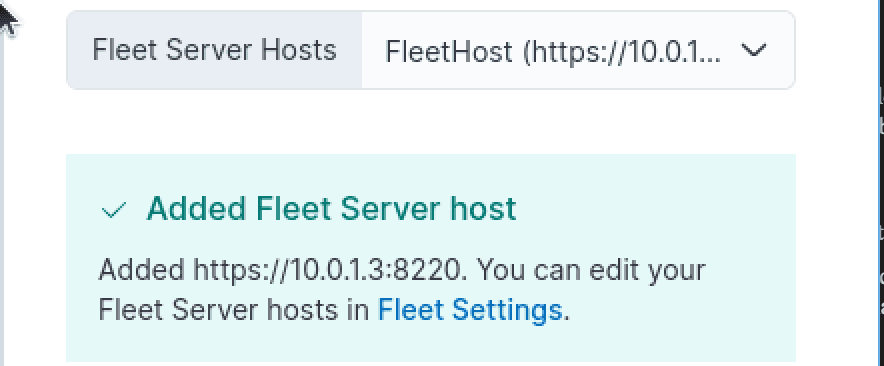
Next, we'll navigate to Fleet > Settings and specify the correct host url for our Elasticsearch cluster
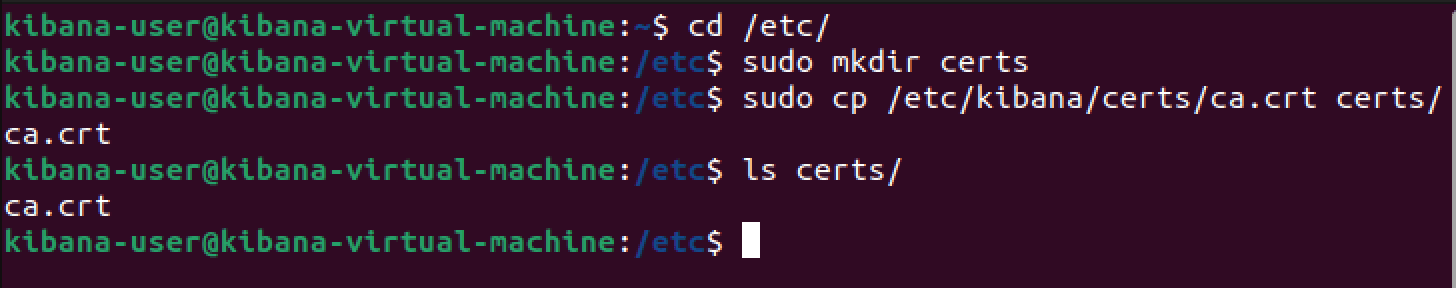
Next, we'll need to supply the Elasticsearch CA in the outputs section. To do so, we'll create a new certs directory within /etc/kibana for Fleet to use to find the Root CA for Elasticsearch, and we'll copy the renamed ca.crt root certificate file into the newly created directory.
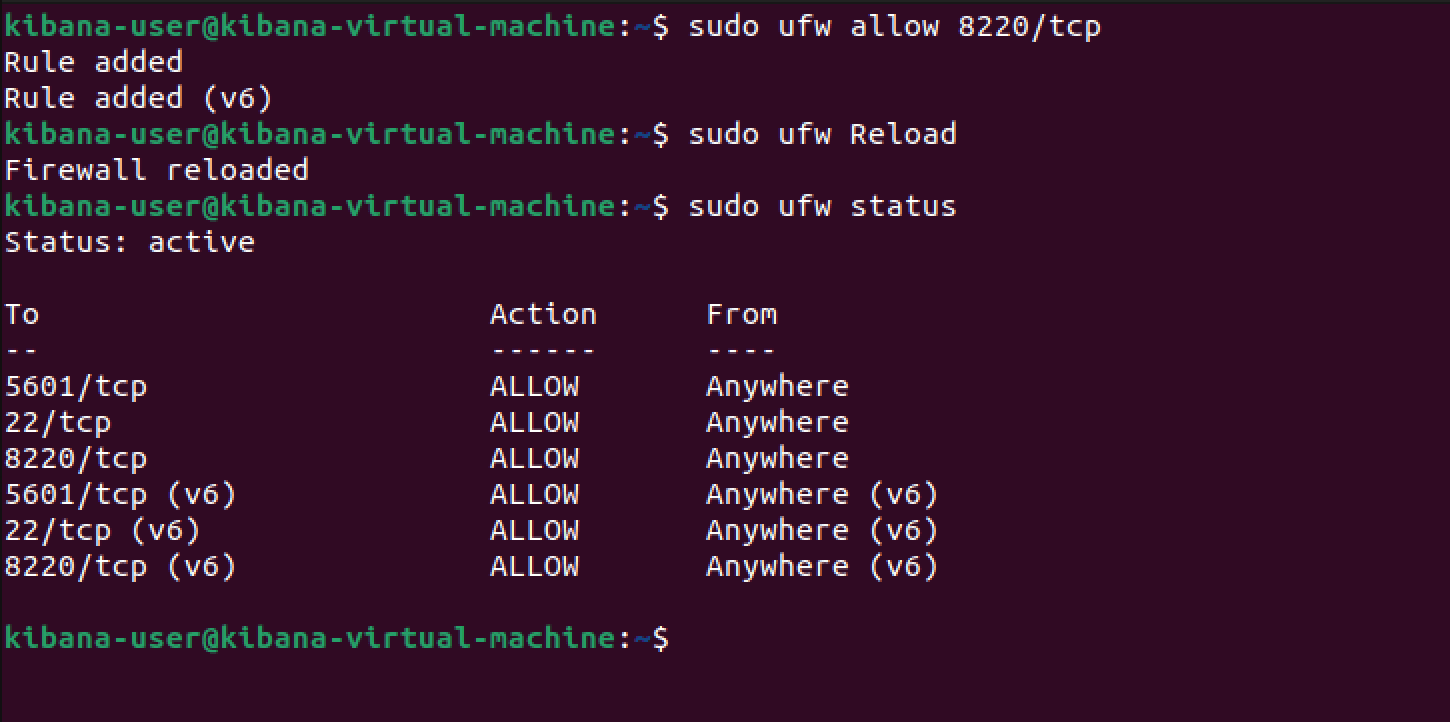
Before continuing, we'll allow traffic on tcp/8220 within the ufw for Fleet traffic
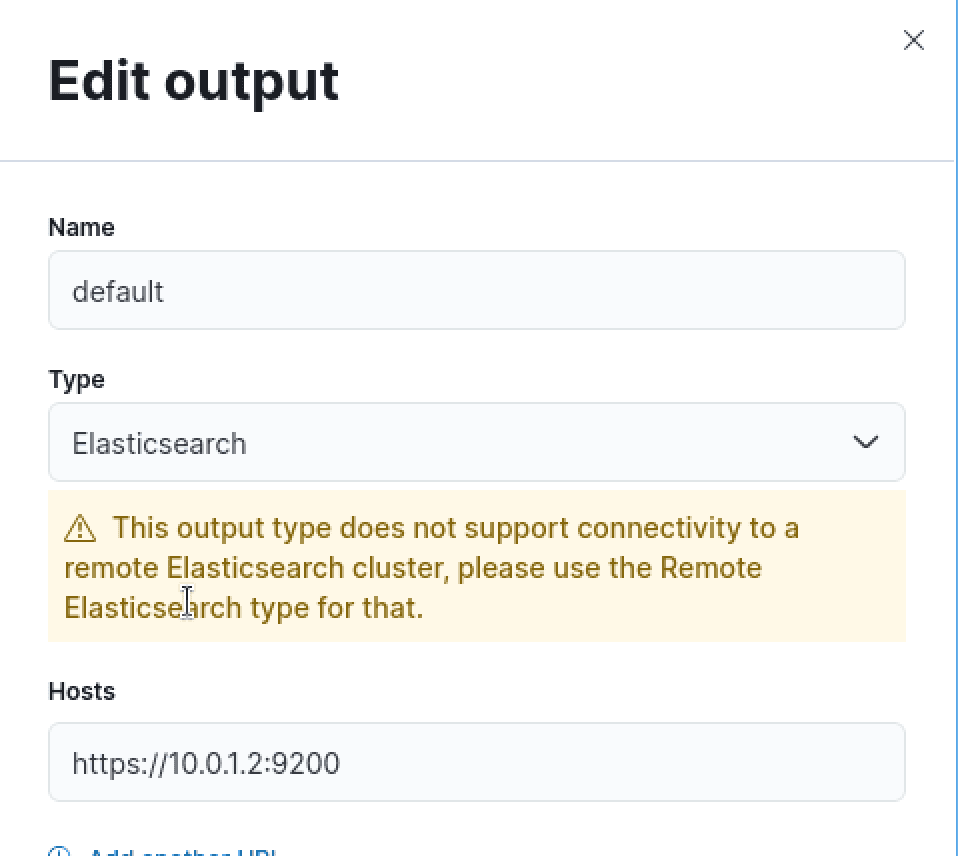
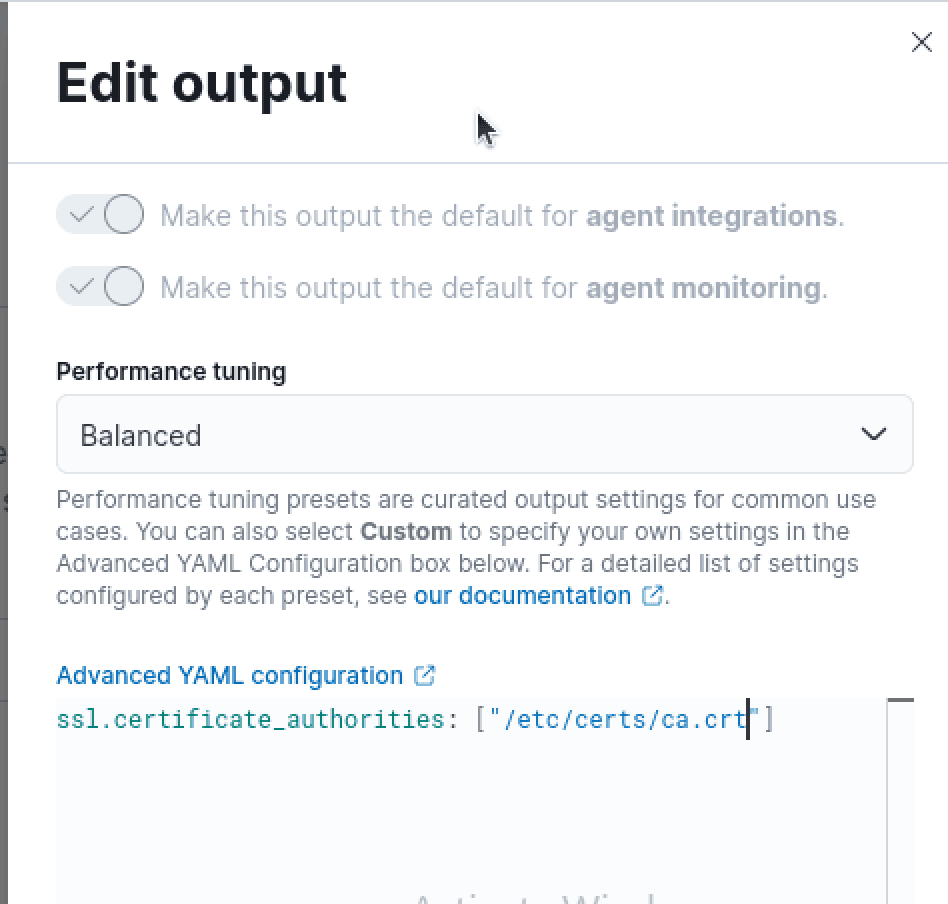
Next, we'll navigate back to our Edit Output window and supply the path to the Root CA whenever specifying the SSL certificate authorities value. This will allow the fleet server to trust the self-signed certificate of our Elasticsearch instance since it has the full SSL chain to verify its identity.
Now that policy should be configured correctly, we're able to generate a Fleet service-token that will automatically be placed into our installation script. The installation script will need editing for our configuration, but before making those edits, we'll need to create a new certificate for our fleet server to use when communicating with Elasticsearch
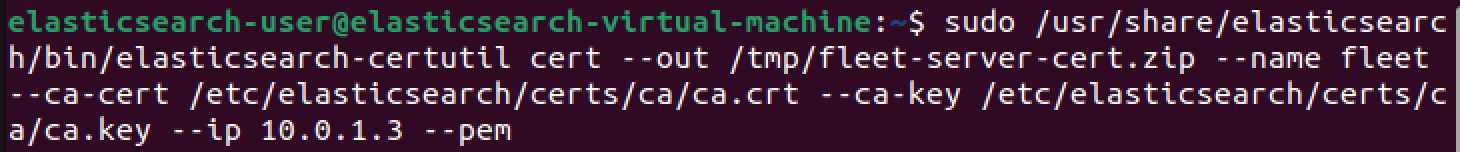
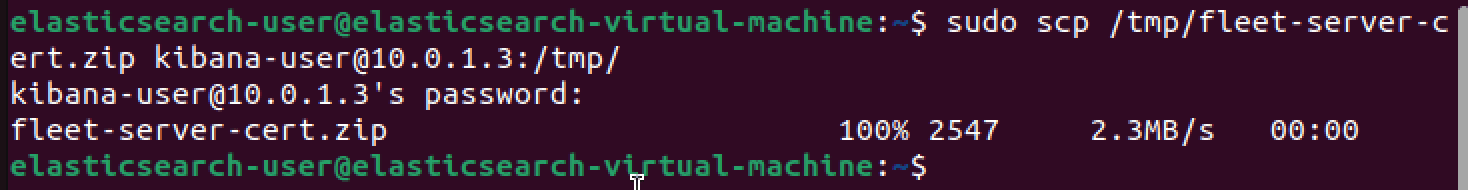
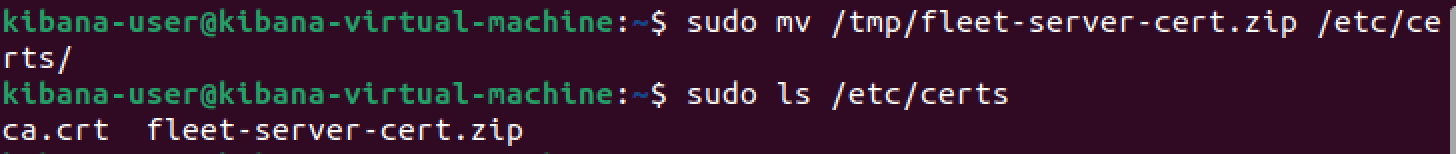
Back on the Elasticsearch VM, we'll generate a new certificate based on the Root CA that we created earlier in the .pem format using the Elasticsearch cert utility. This will create fleet-server-cert.zip file within our /tmp/ directory that we will move to our Kibana/Fleet VM and unzip
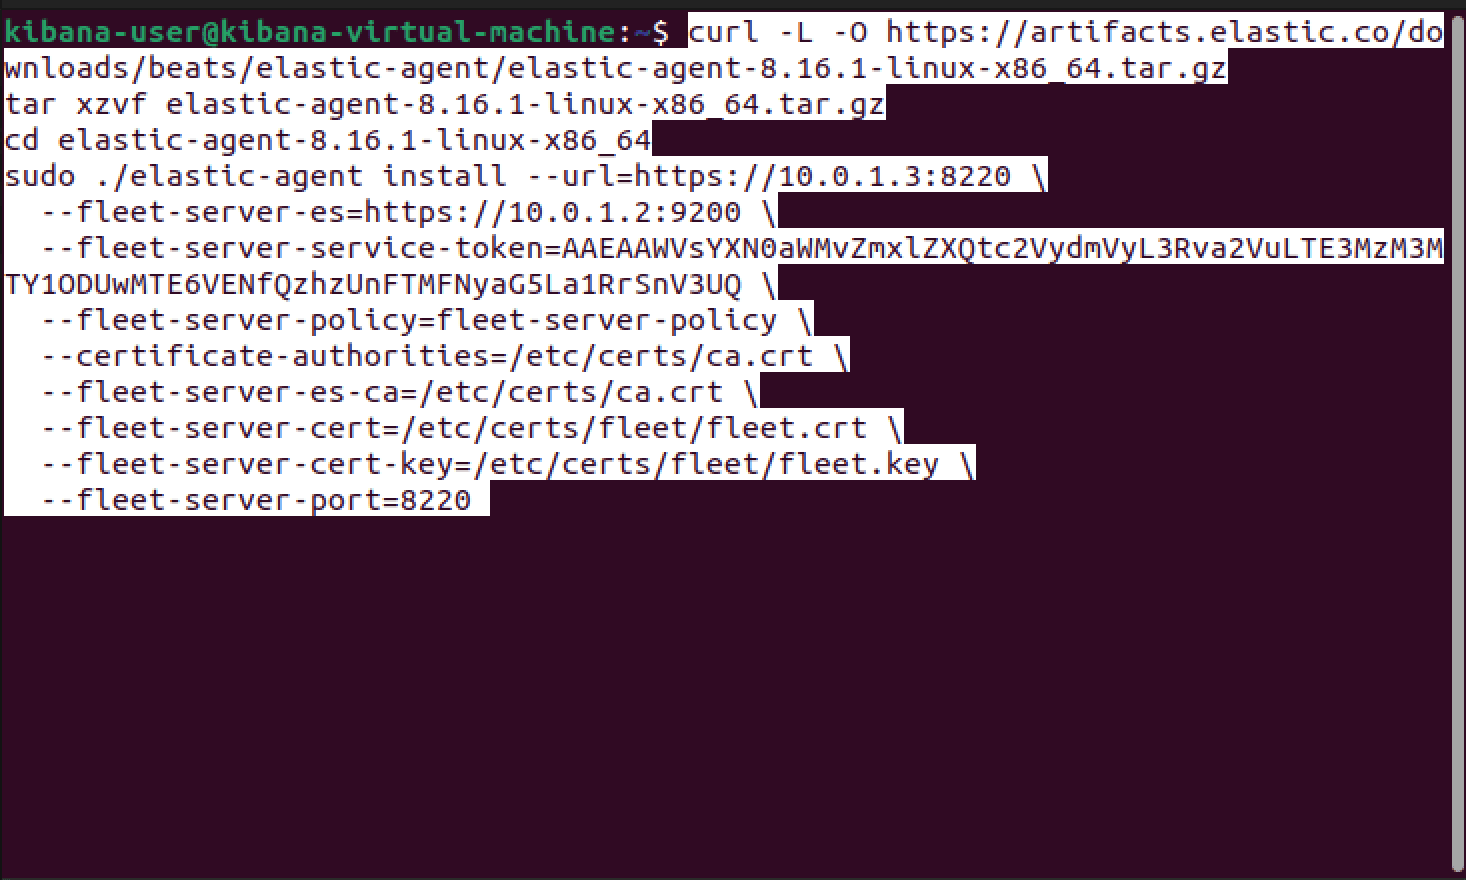
Now that our certificate and key are in place for our Fleet server, we can take our installation script and run it on our Kibana machine which is also hosting our Fleet server. Firstly, we can make the following changes to specify our Elasticsearch and Fleet CA, as well at the certificate and key that Fleet will use.
certificate-authorities=/etc/certs/ca.crt
fleet-server-es-ca=/etc/certs/ca.crt
fleet-server-cert=/etc/certs/fleet/fleet.crt
fleet-server-cert-key=/etc/certs/fleet/fleet.key
Then, after our changes, we can run this command.
Now that our certificate and key are in place for our Fleet server, we can take our installation script and run it on our Kibana machine, which is also hosting our Fleet server.
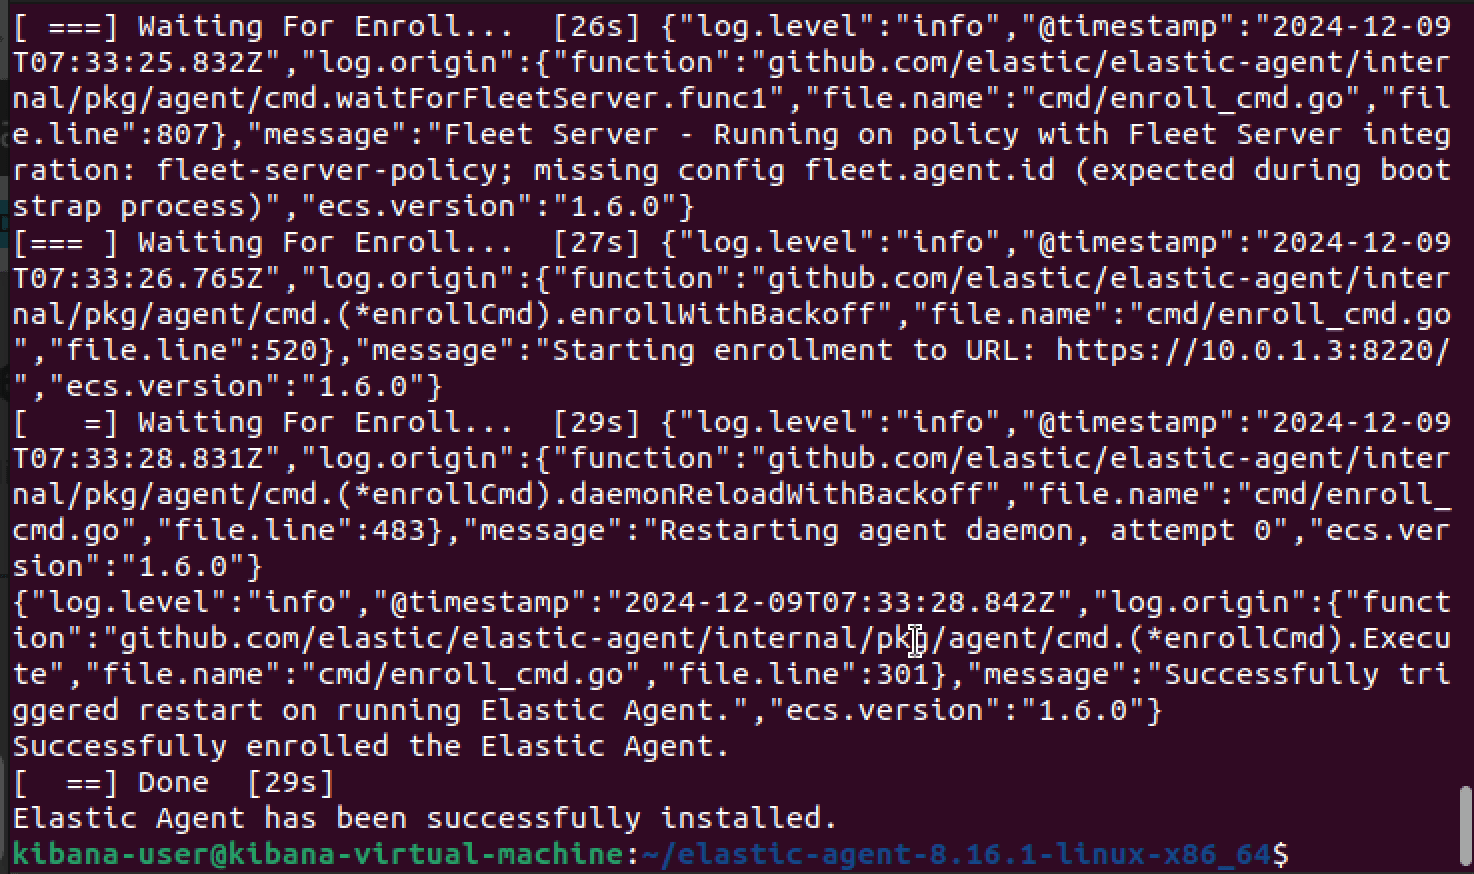
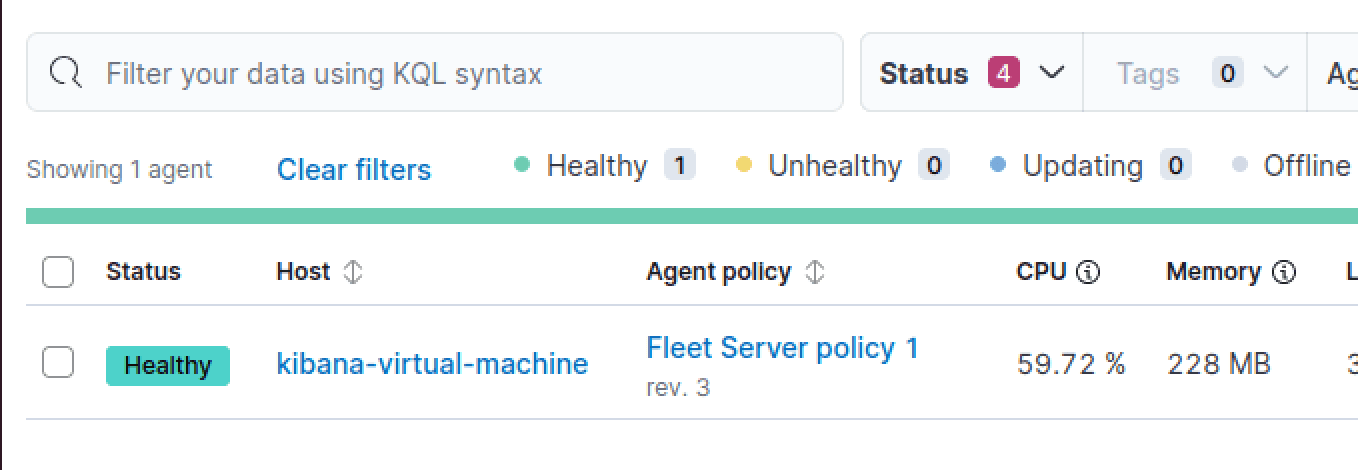
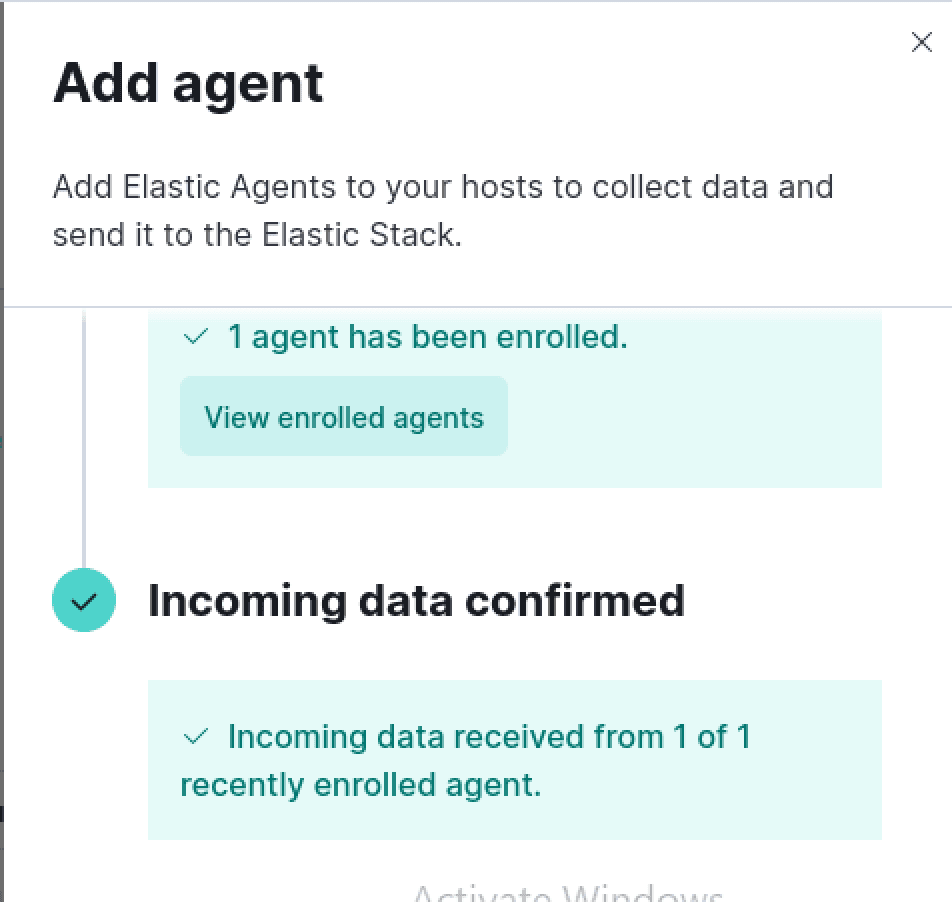
After the running the installation script, we can see that enrollment has succeeded, and that we can verify the Fleet Server instance on the Kibana web interface.
Now that we've finished deploying the Fleet server on our Kibana VM, we can install the individual elastic-agent service on our Ubuntu user VM.
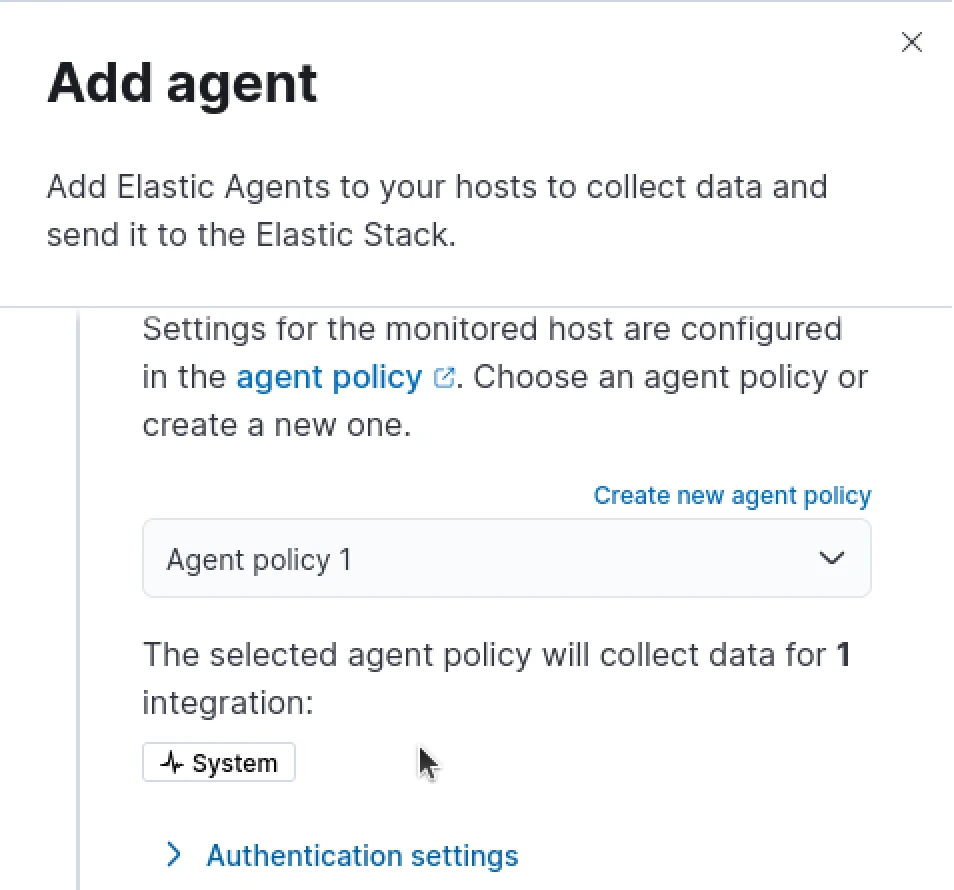
From the Fleet Server agent page, we can select "Add Agent" option to begin
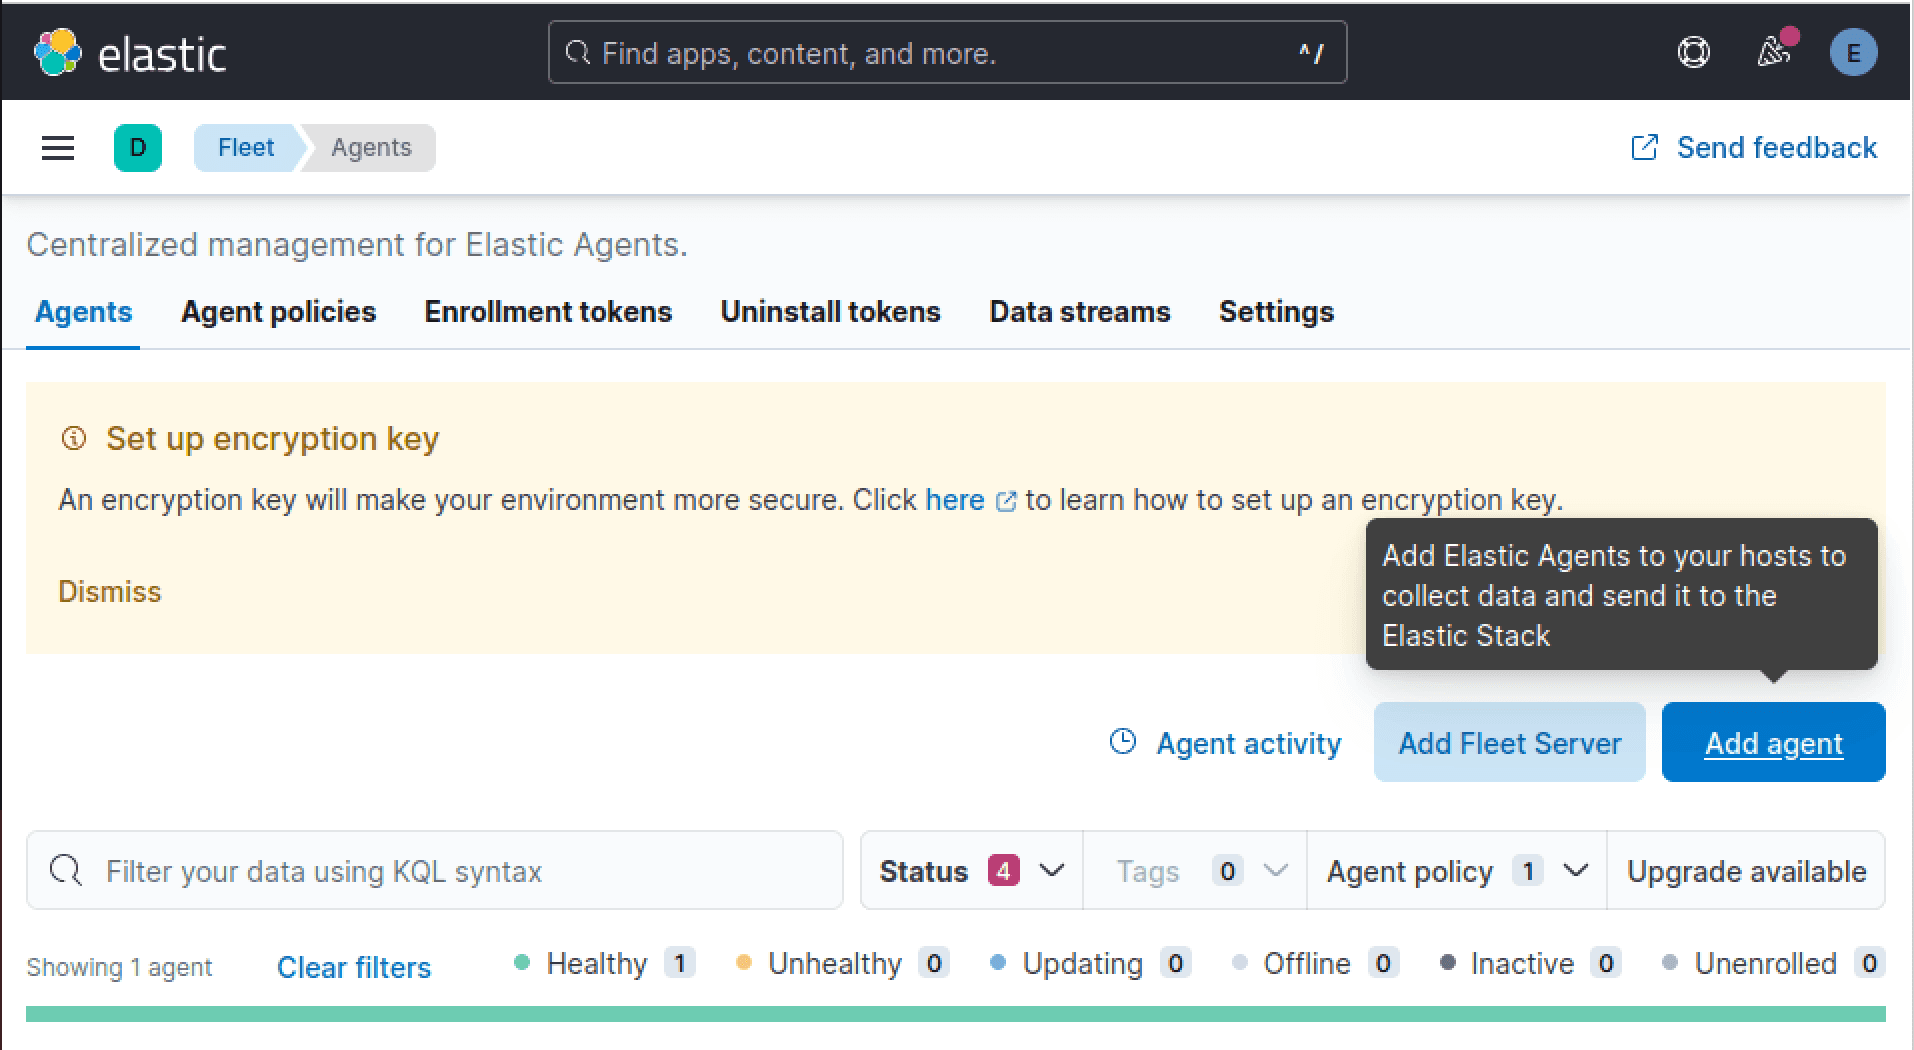
Within the right-pane window that opens, we will create our default agent policy that will be pushed to the deployment Elastic agent
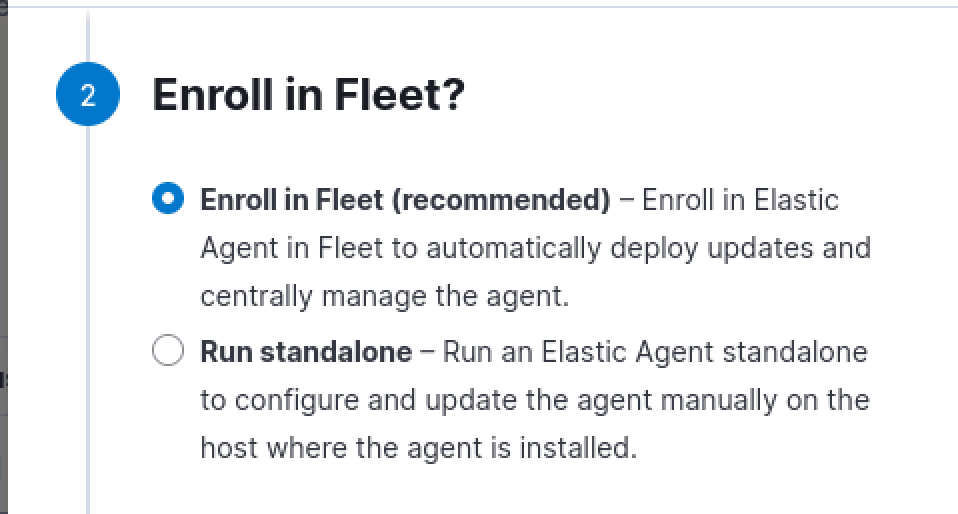
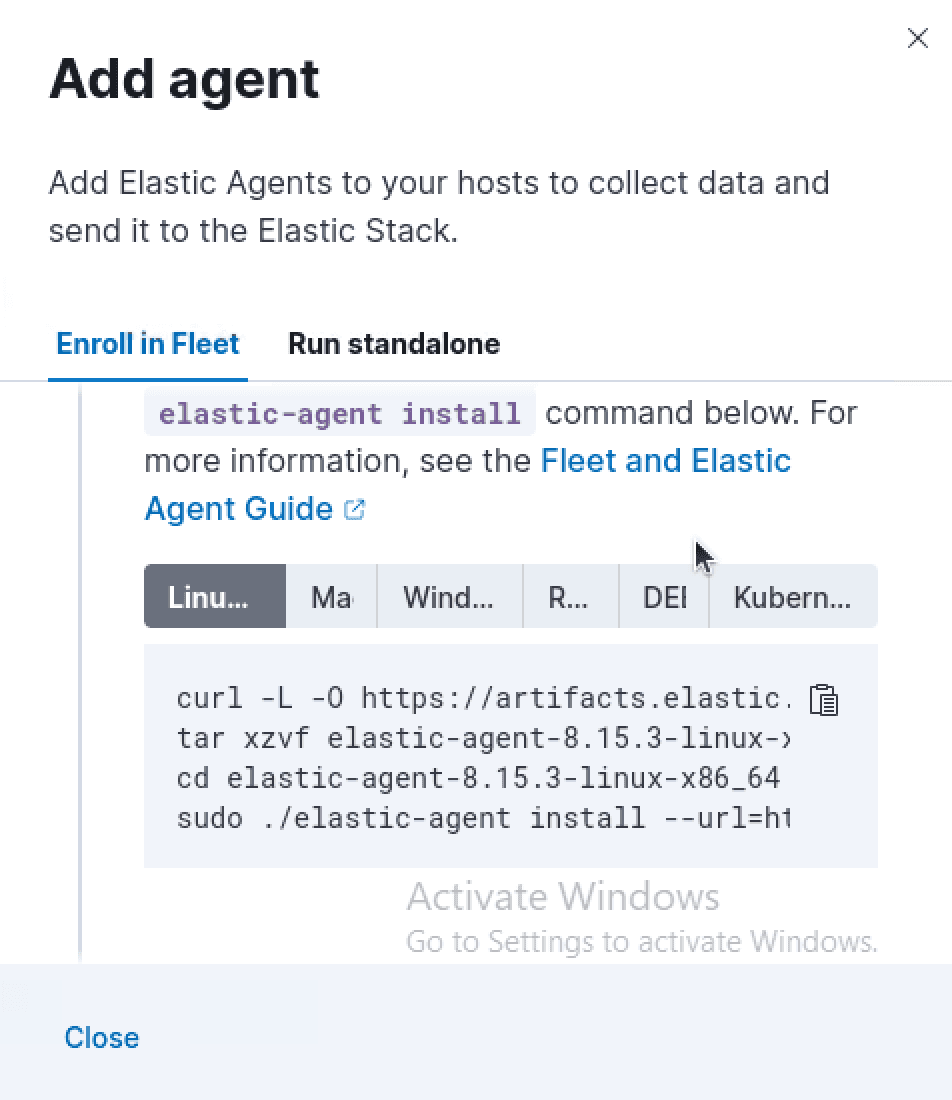
In the second drop-down we will select to "Enroll in Fleet"
We will then be provided with an installation script that we will make edits to to ensure proper functionality with the self-signed certificates in use in our Elastic Stack Deployment. Before we make edits to this installation script however, we'll deploy a new VM that is to function as a ubuntu-based user workstation. This will be the machine that is used for Elastic Agent's enrollment with our Fleet server. The creation of a secure enrollment token satisfies NIST SP 800-53 SC-13 compliant on secure encryption.
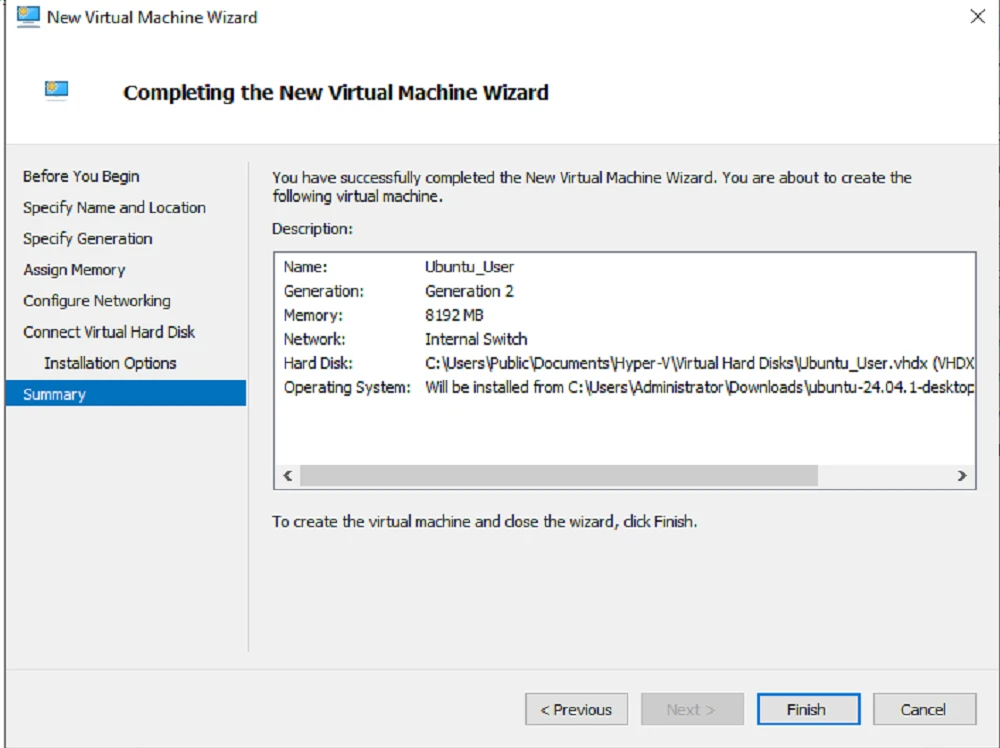
To begin, we'll navigate back to VMHOST and create a new VM named Ubuntu-User which will have the following configurations:
OS: Ubuntu 24.04
Memory: 8Gb
Diskspace: 127Gb
Networking: Internal Switch Bridged @ 10.0.1.0/28
Next, we'll need to move our Elasticsearch ca.crt file from our Kibana machine to our ubuntu-user machine as the Fleet server has the same root ca file it is using in policy
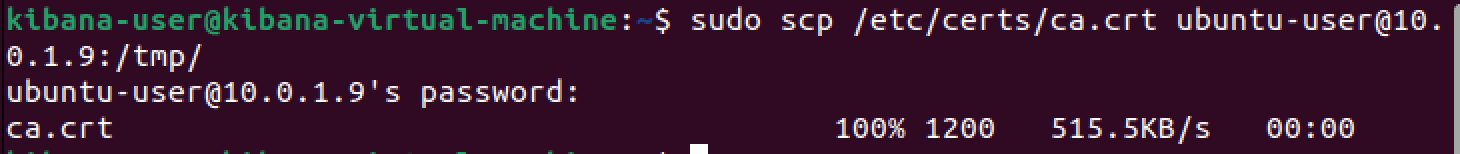
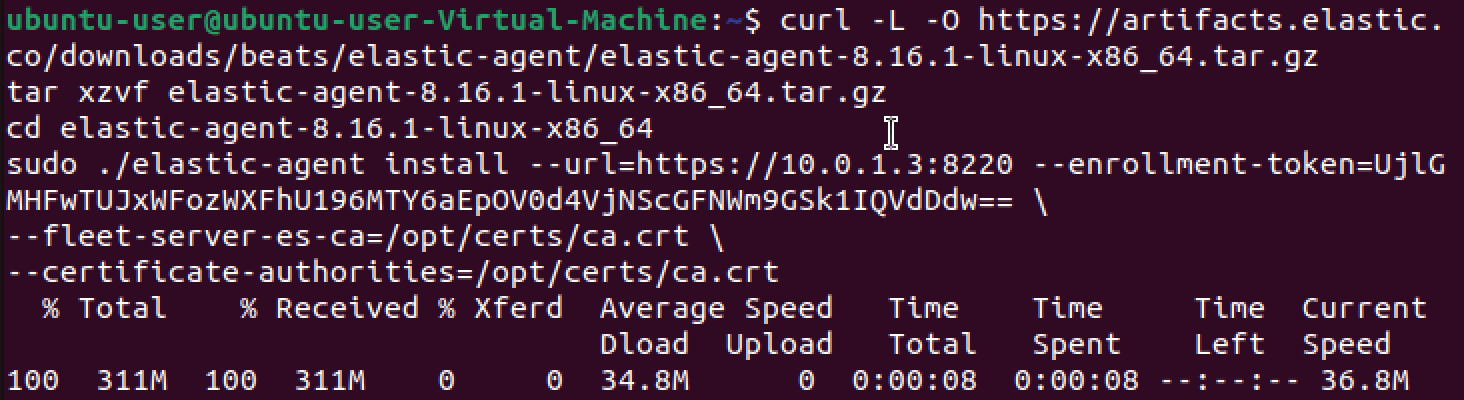
After installing Ubuntu we'll logon, install updates, and begin making edits to our Elastic-agent installation and enrollment script that will include:
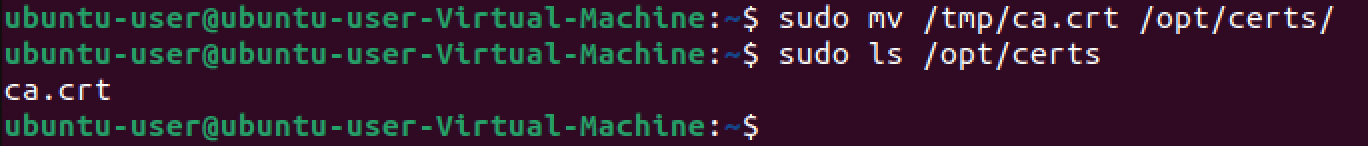
After making our changes, we'll move the ca.crt scp'd from our Kibana VM to the /opt/certs directory and run the enrollment script
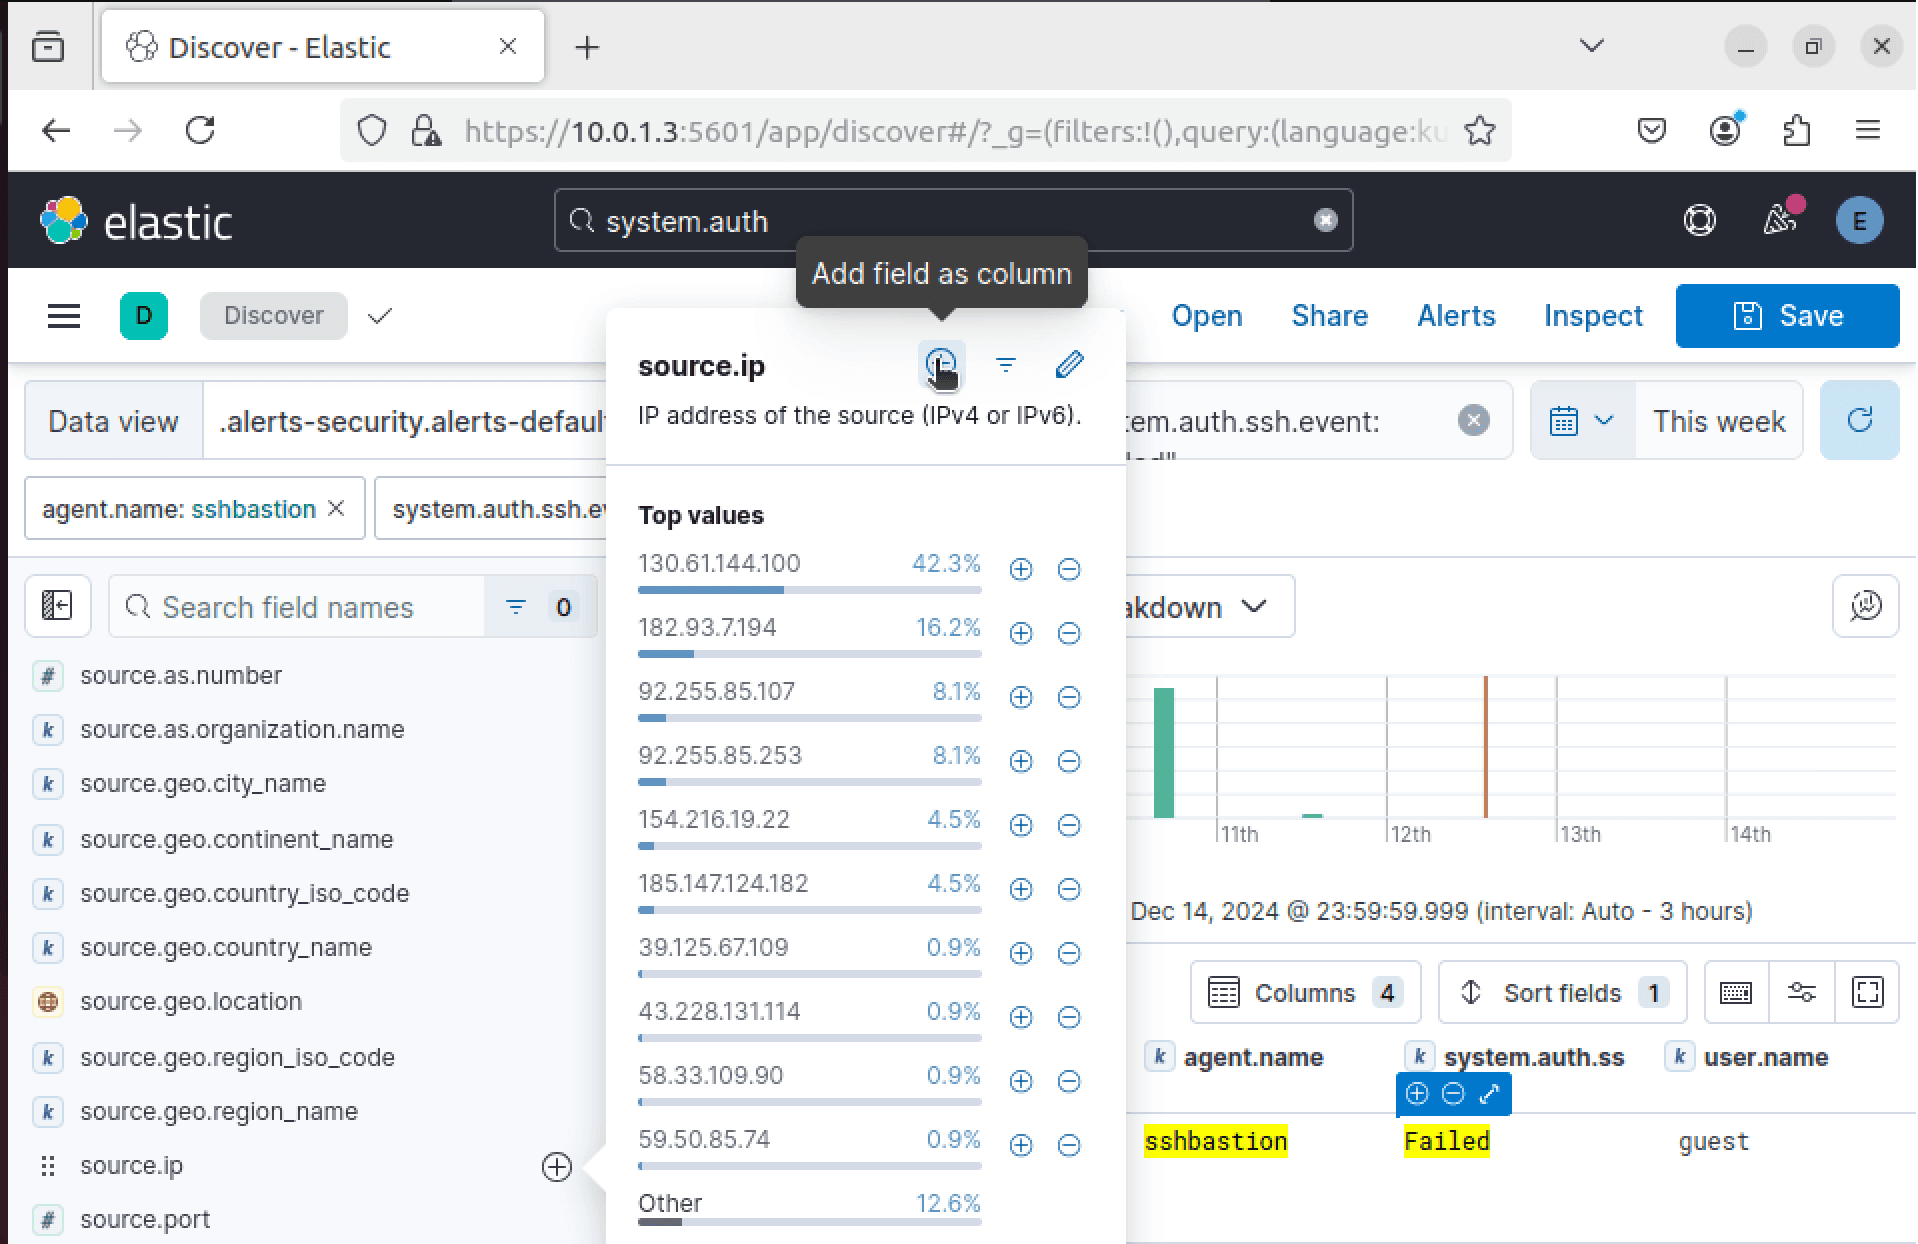
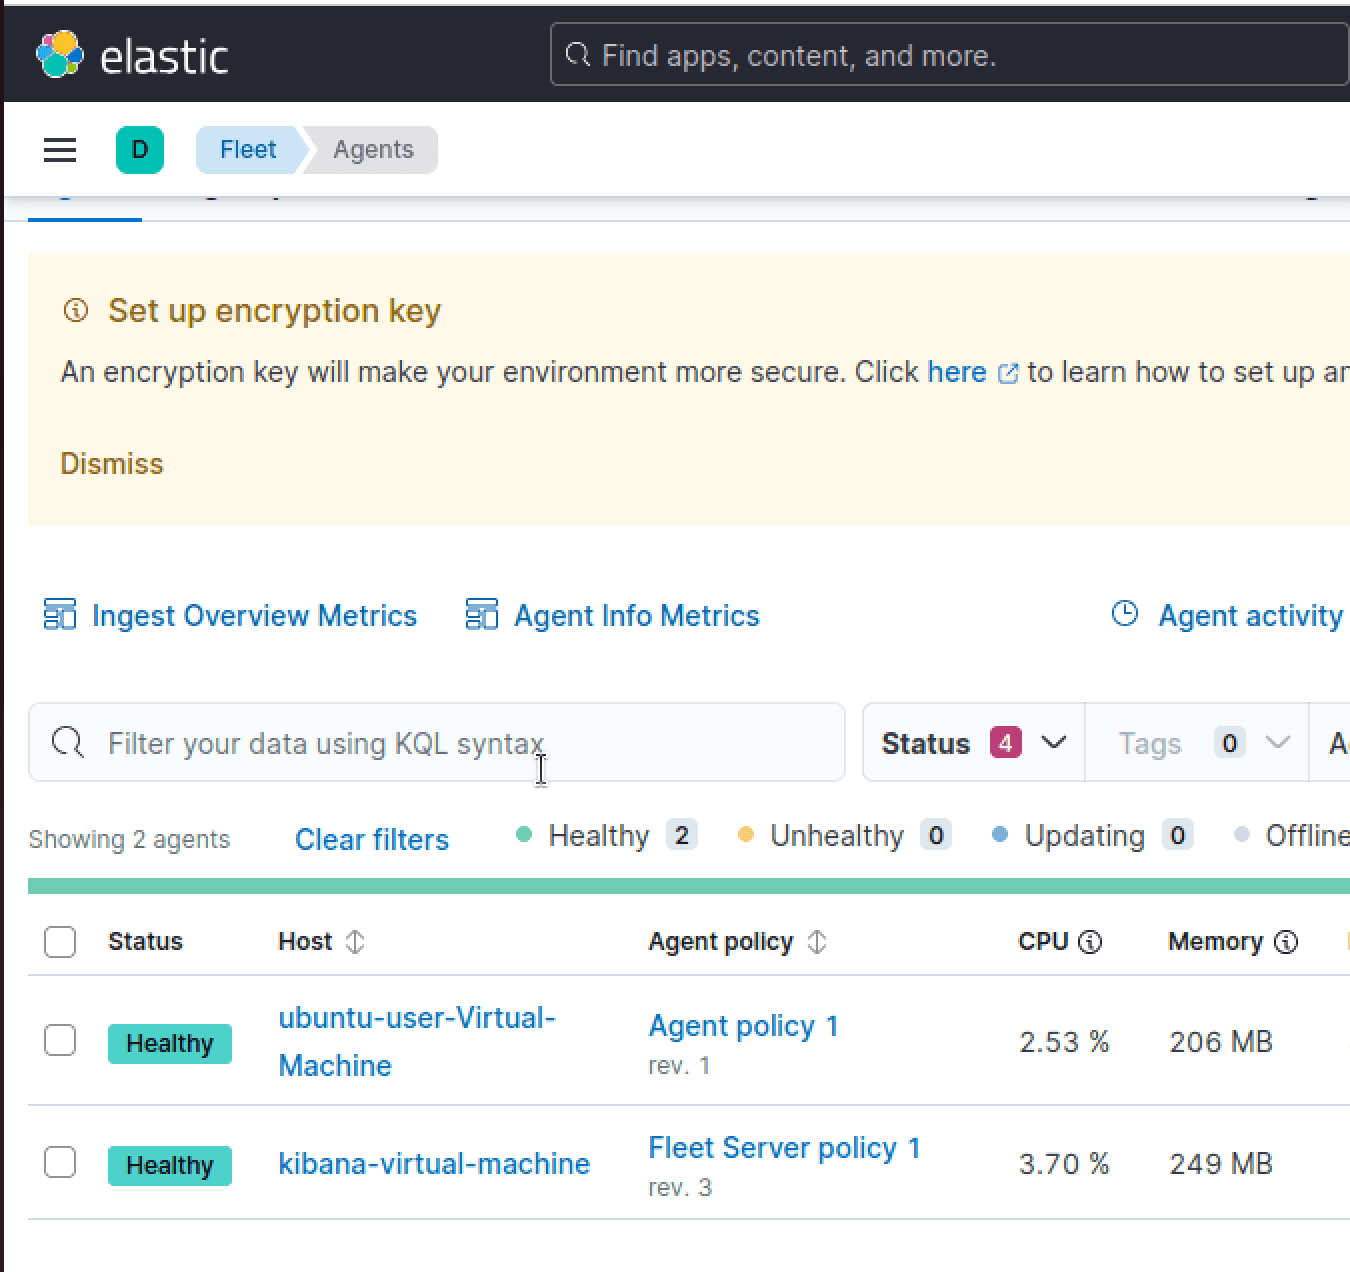
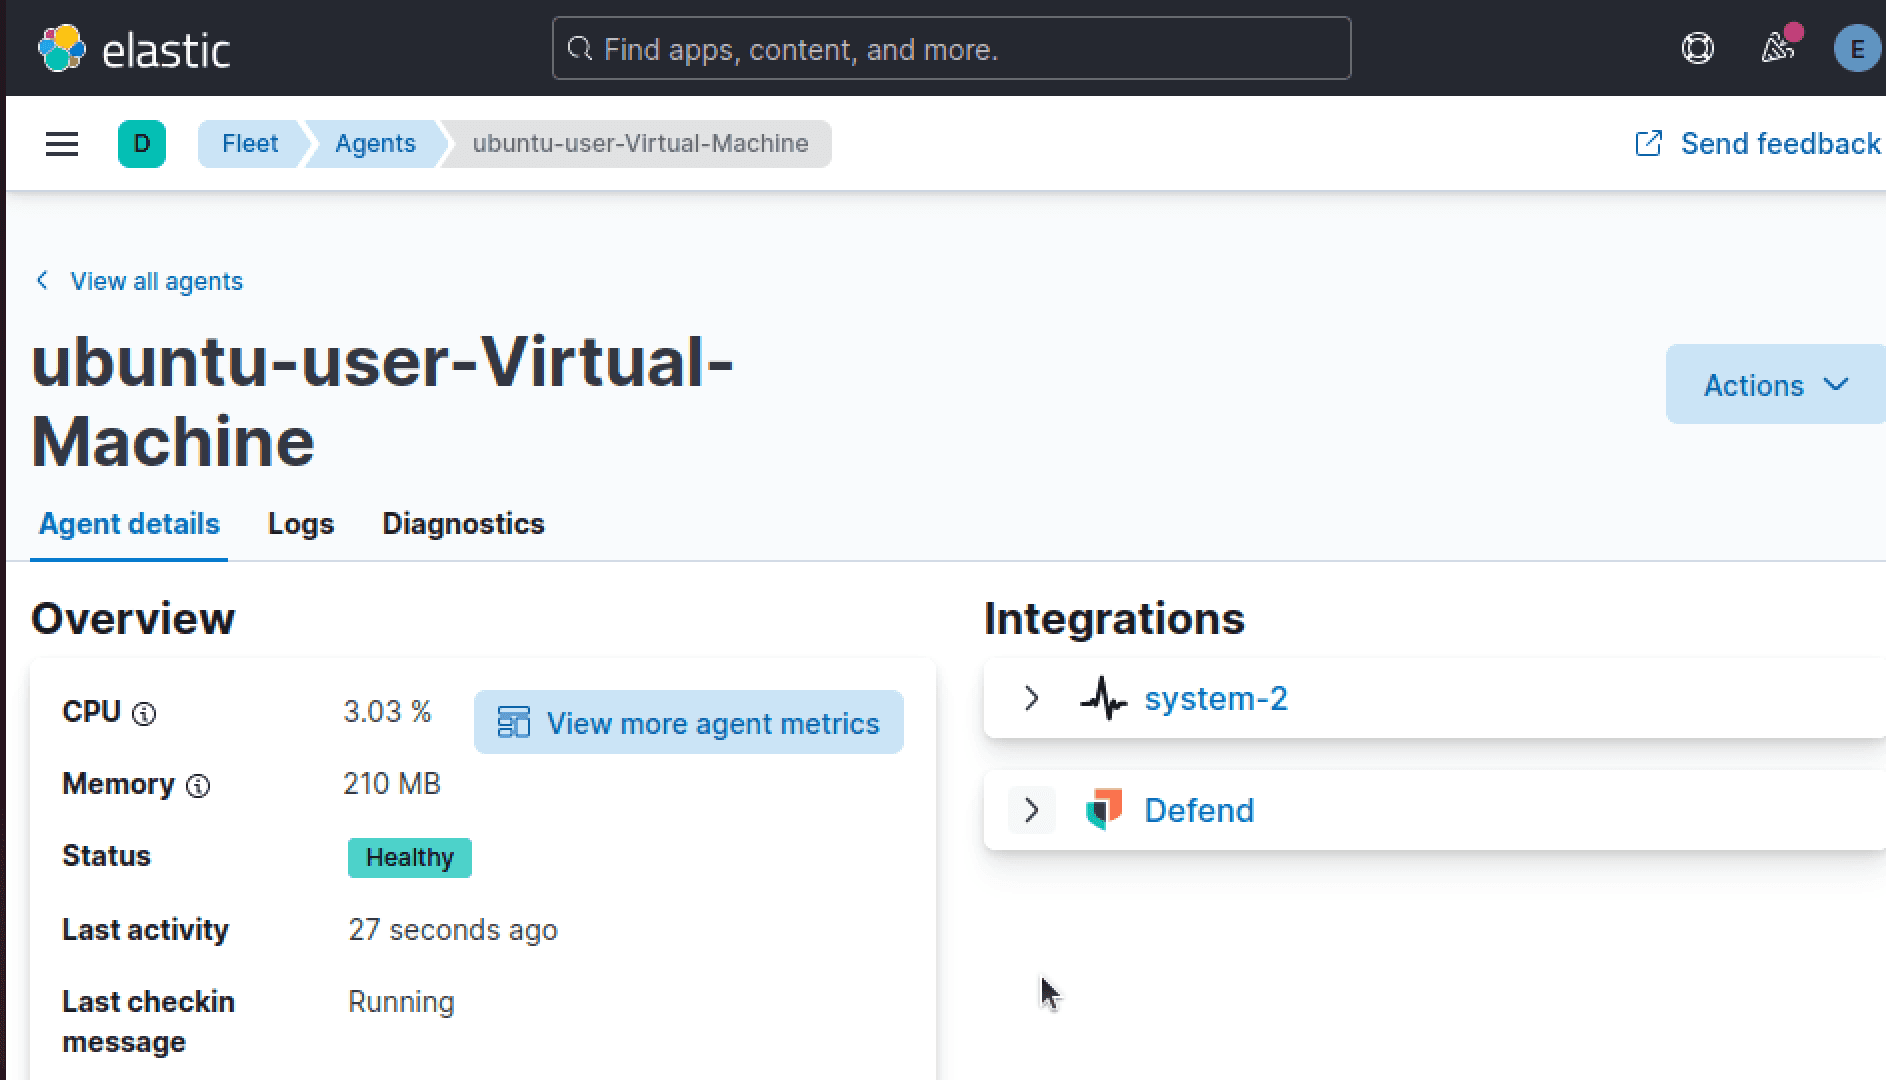
We'll now need to confirm that Elastic agent enrollment was successful, and we can do so by logging back into our Kibana VM and checking Fleet > Agent section to find that our ubuntu-user-Virtual-Machine has been listed successfully.
In order to add EDR functionality to our SOAR implementation, we'll need to utilize the Elastic Defend integration. Within the Kibana search bar, we can navigate to "Integrations" and find Elastic Defend. Then we can simply select "Add"
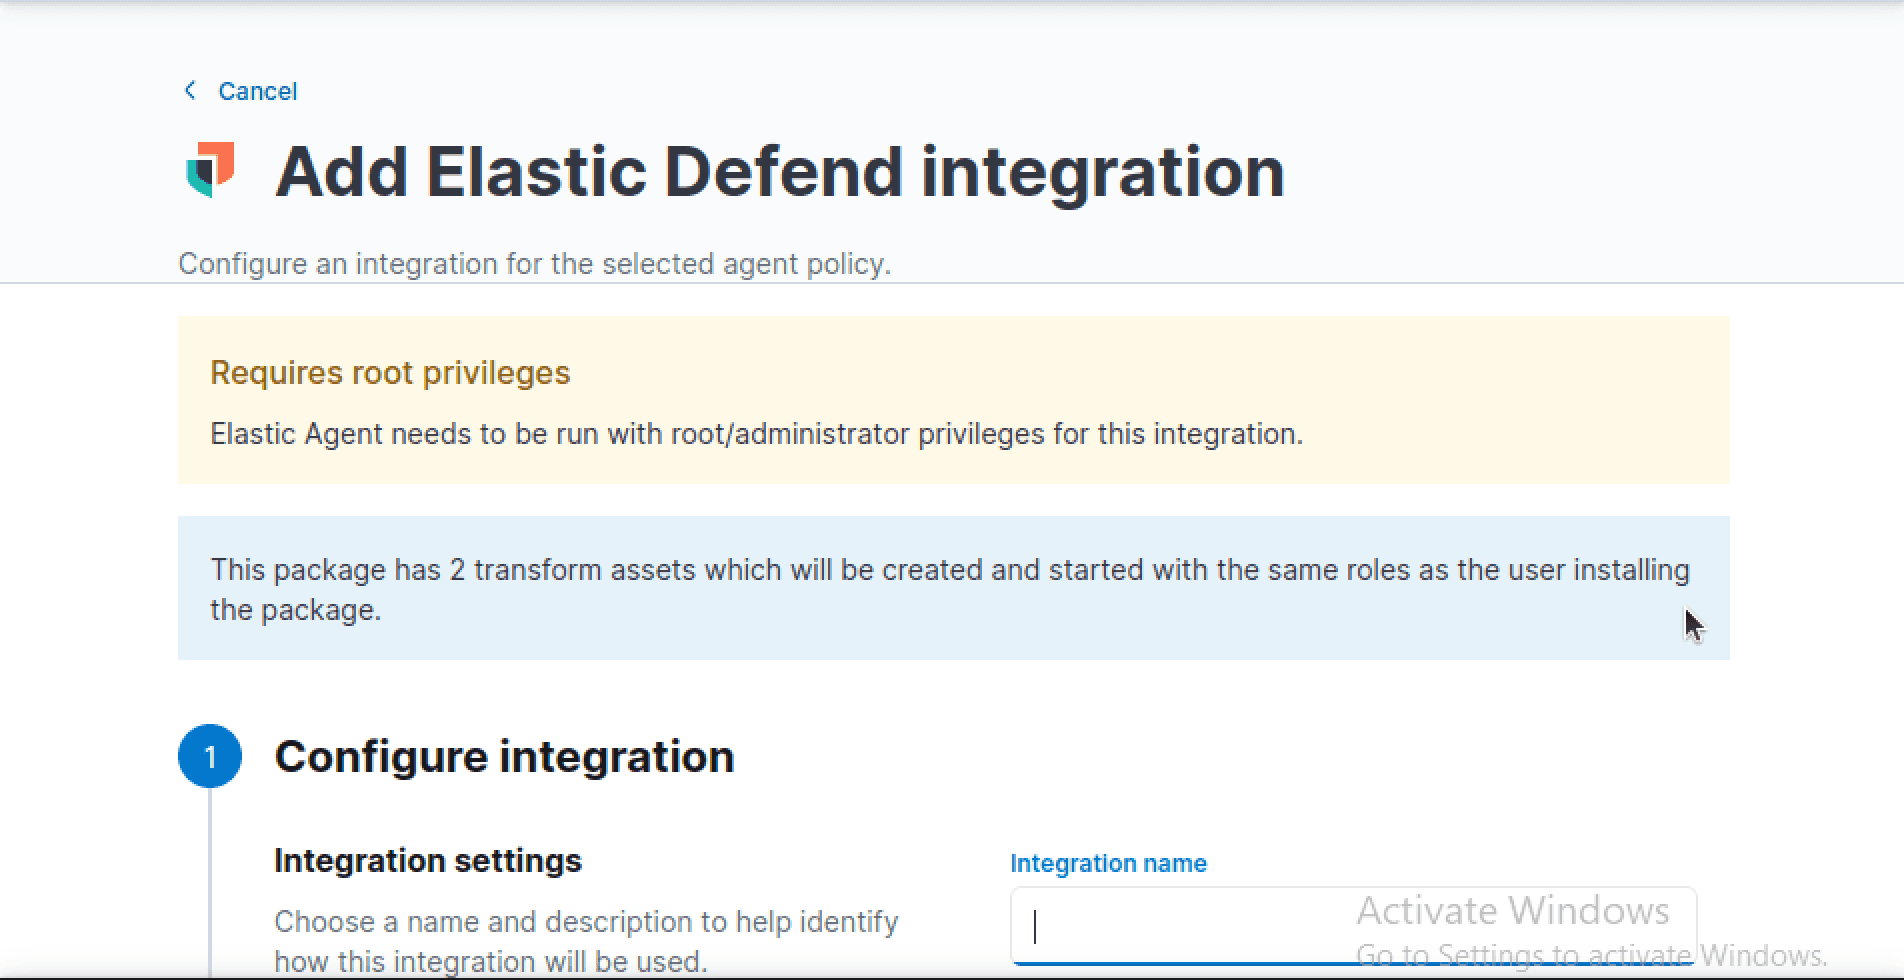
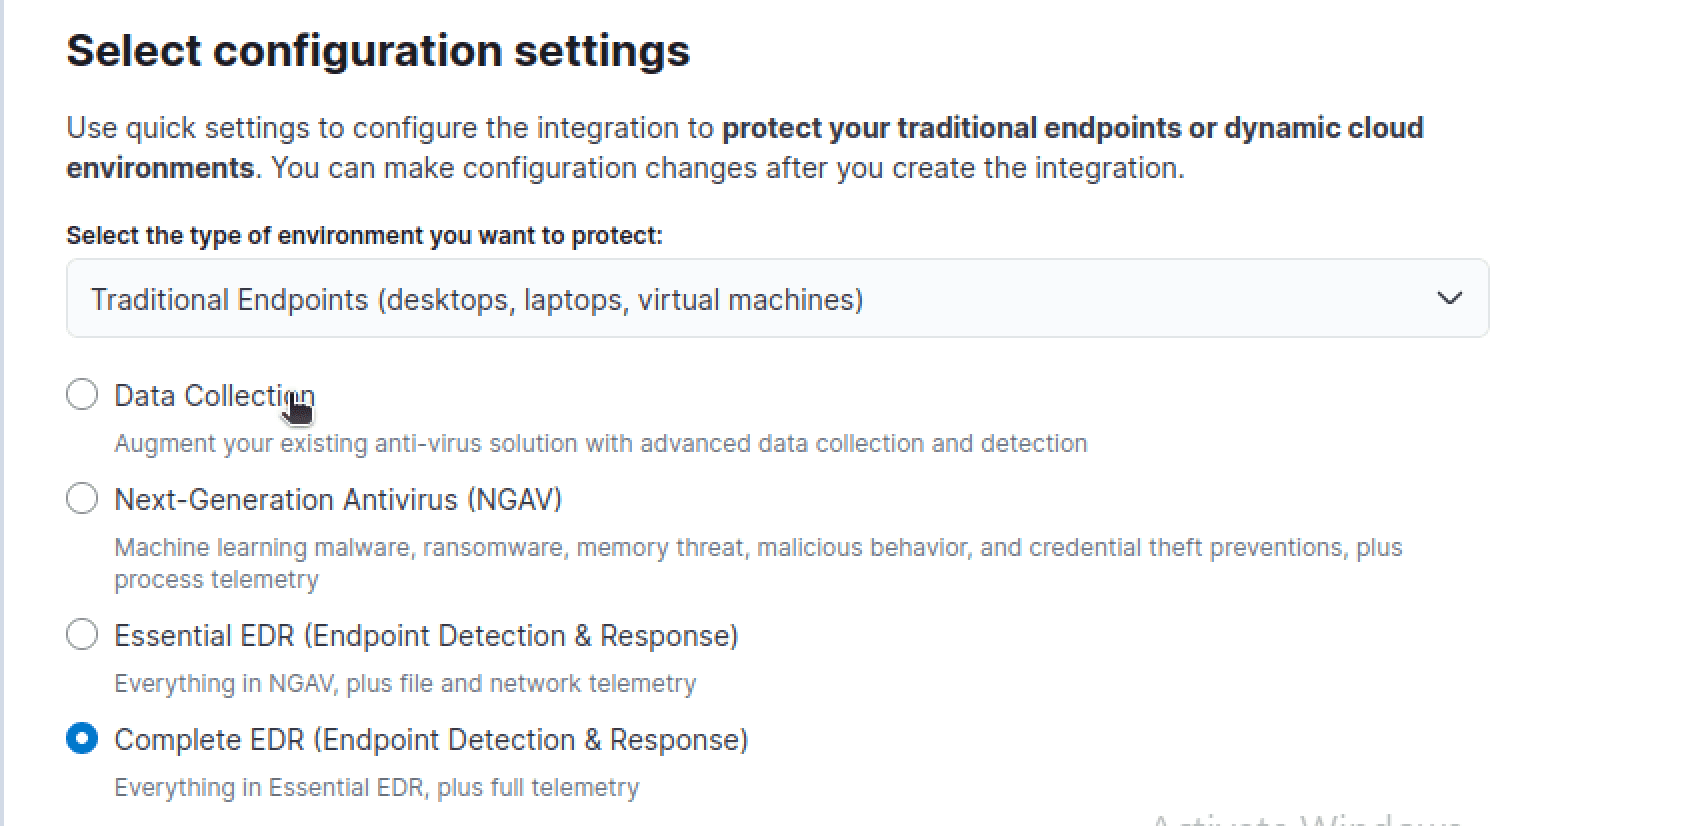
From the next menu, we can supply a name and select "Complete EDR" under the dialog to configure settings
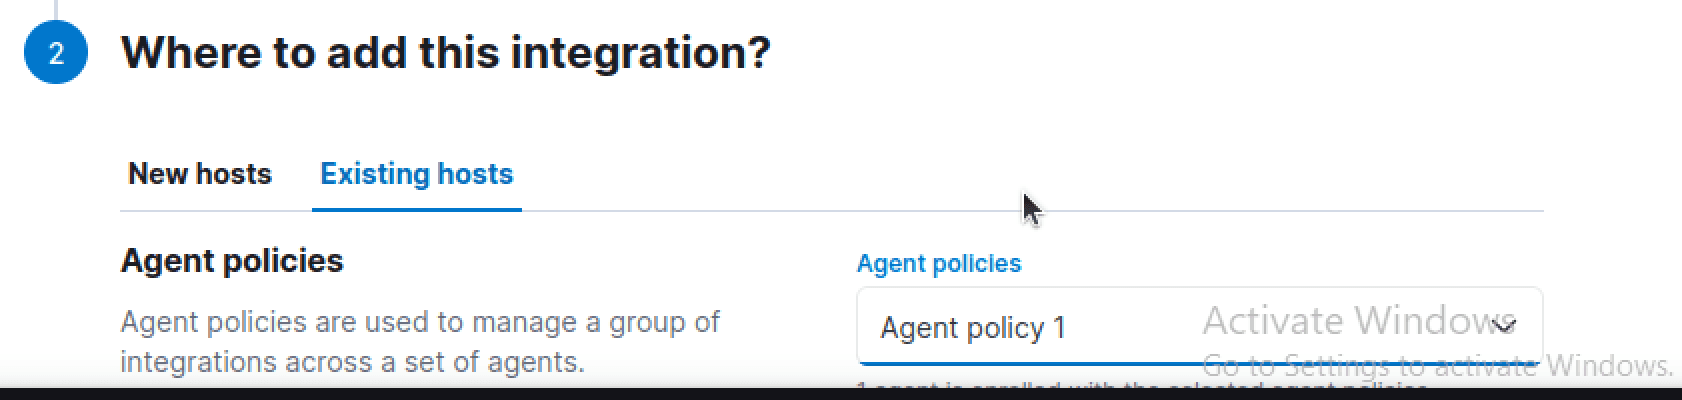
Finally, we can push this integration into our existing policy, "Agent Policy 1" and we can verify that it was pushed to our currently running agent on our Ubuntu user machine
With the Elastic Defend Integration added, we'll finally deploy a triage ticketing system for our Security Incidents. To fulfill this need, we'll go with the Security Incident Case Management Software "TheHive" from StrangeBee.
TheHive is a open-source SOAR platform that can help orchestrate some of our workflows using other tools that have been deployed in the project together.
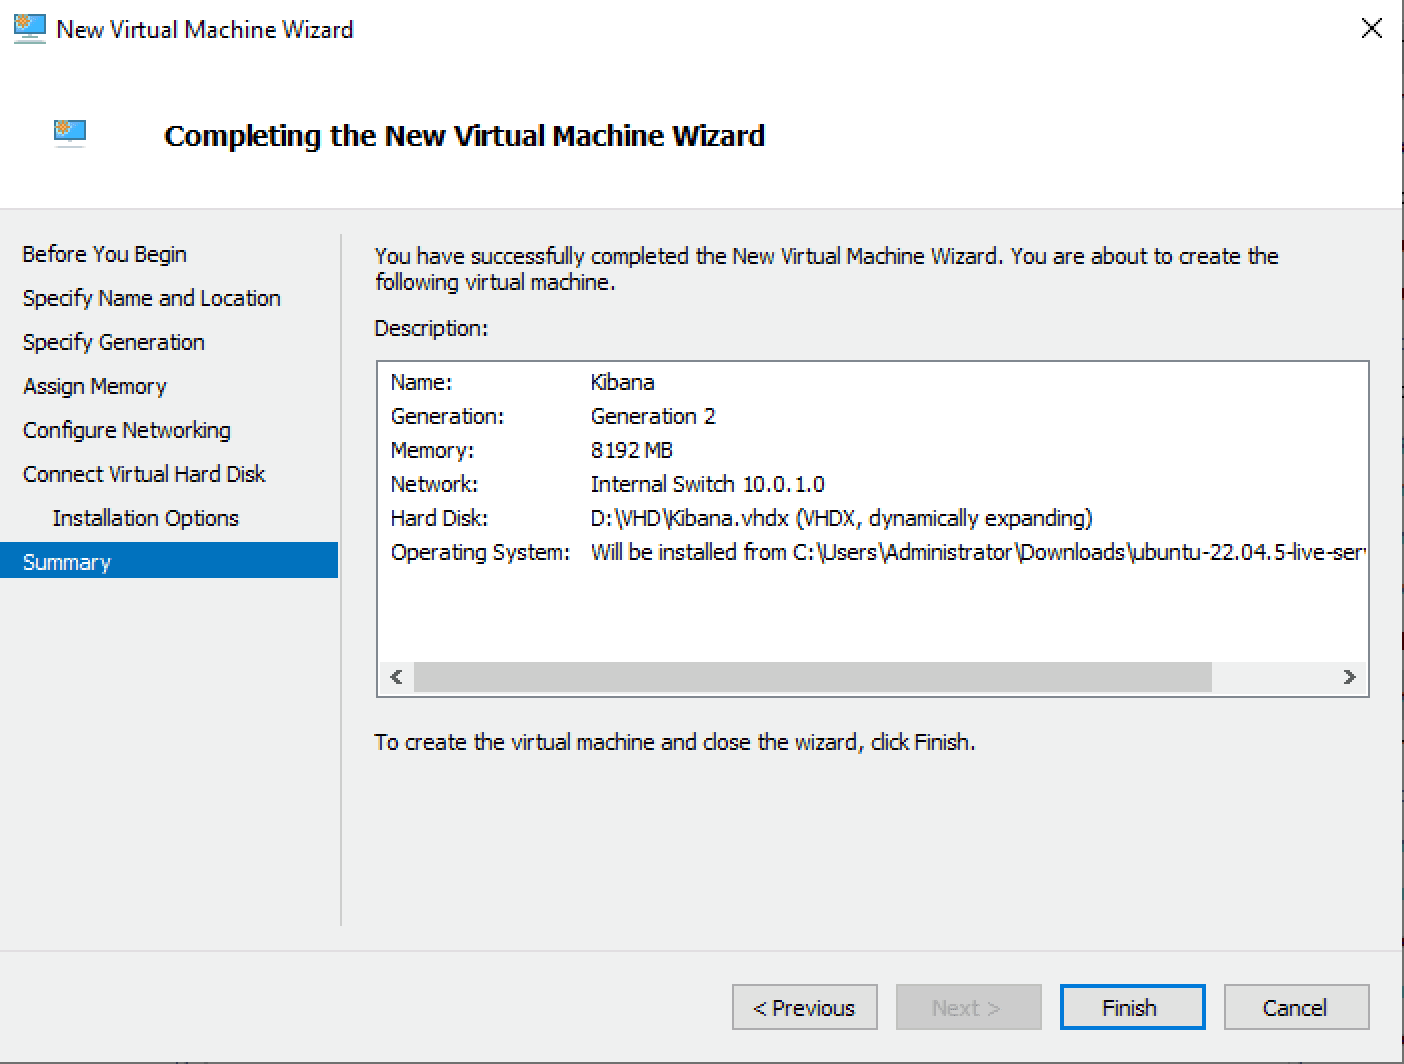
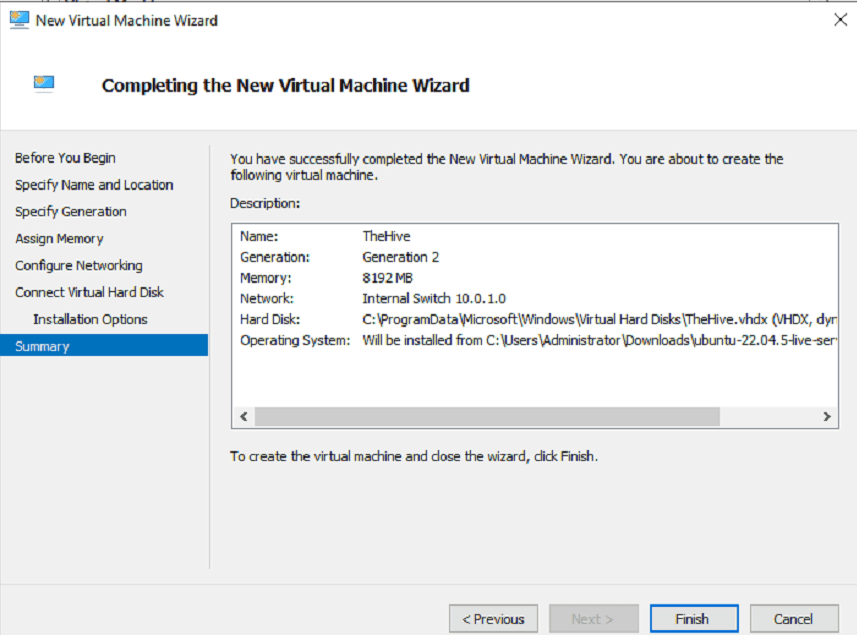
To begin, we'll navigate back to our Hyper-V Manager and deploy a new VM under the name "TheHive" with the following configurations:
OS: Ubuntu Server 24.04
Memory: 8Gb
DiskSpace: 127Gb
Networking: Internal Switch Bridged at @ 10.0.1.0/28
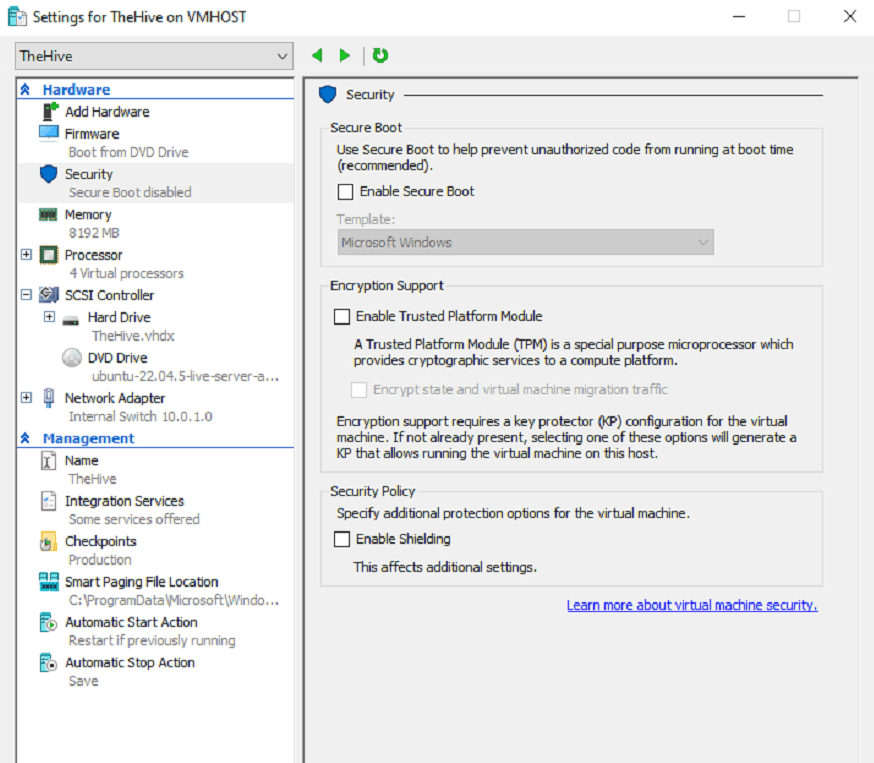
As with our previous Ubuntu-based VMs, we'll disable Secure Boot, and increase the number of vCPUs running on the system
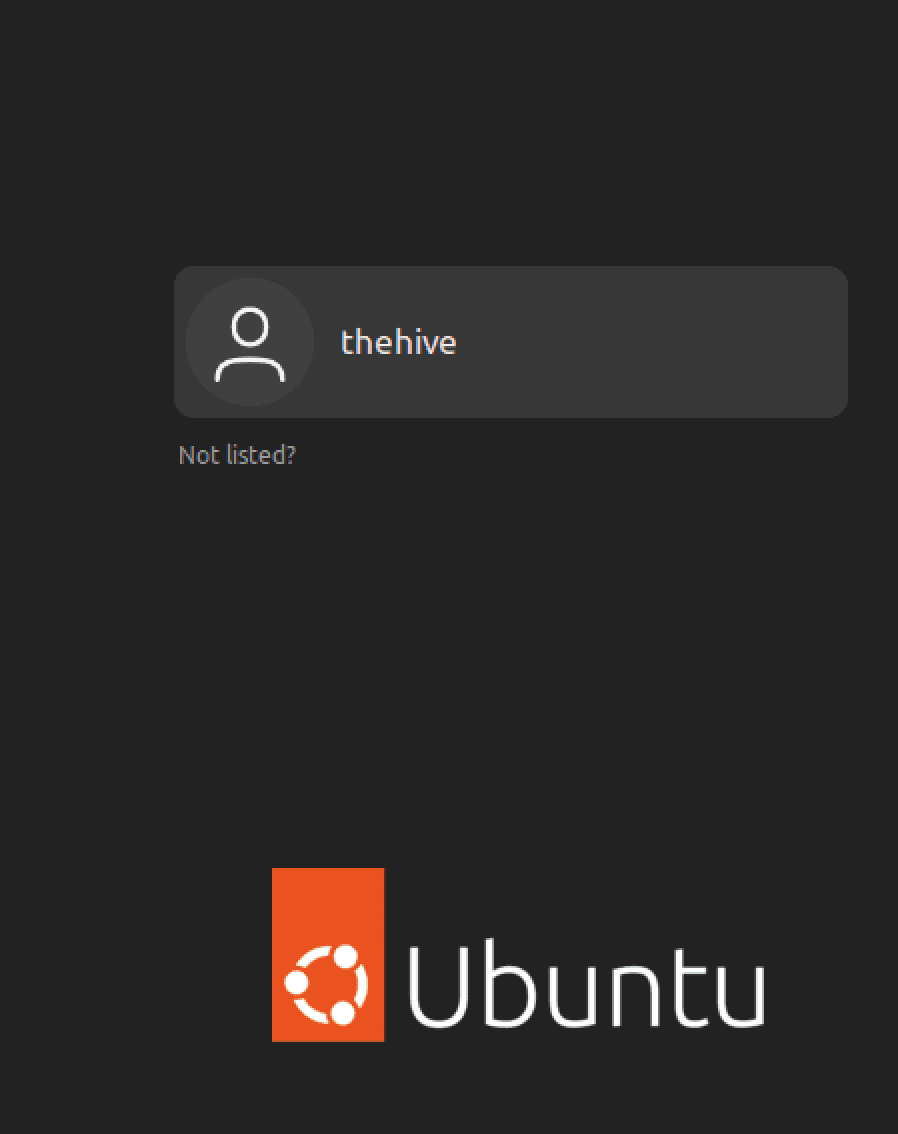
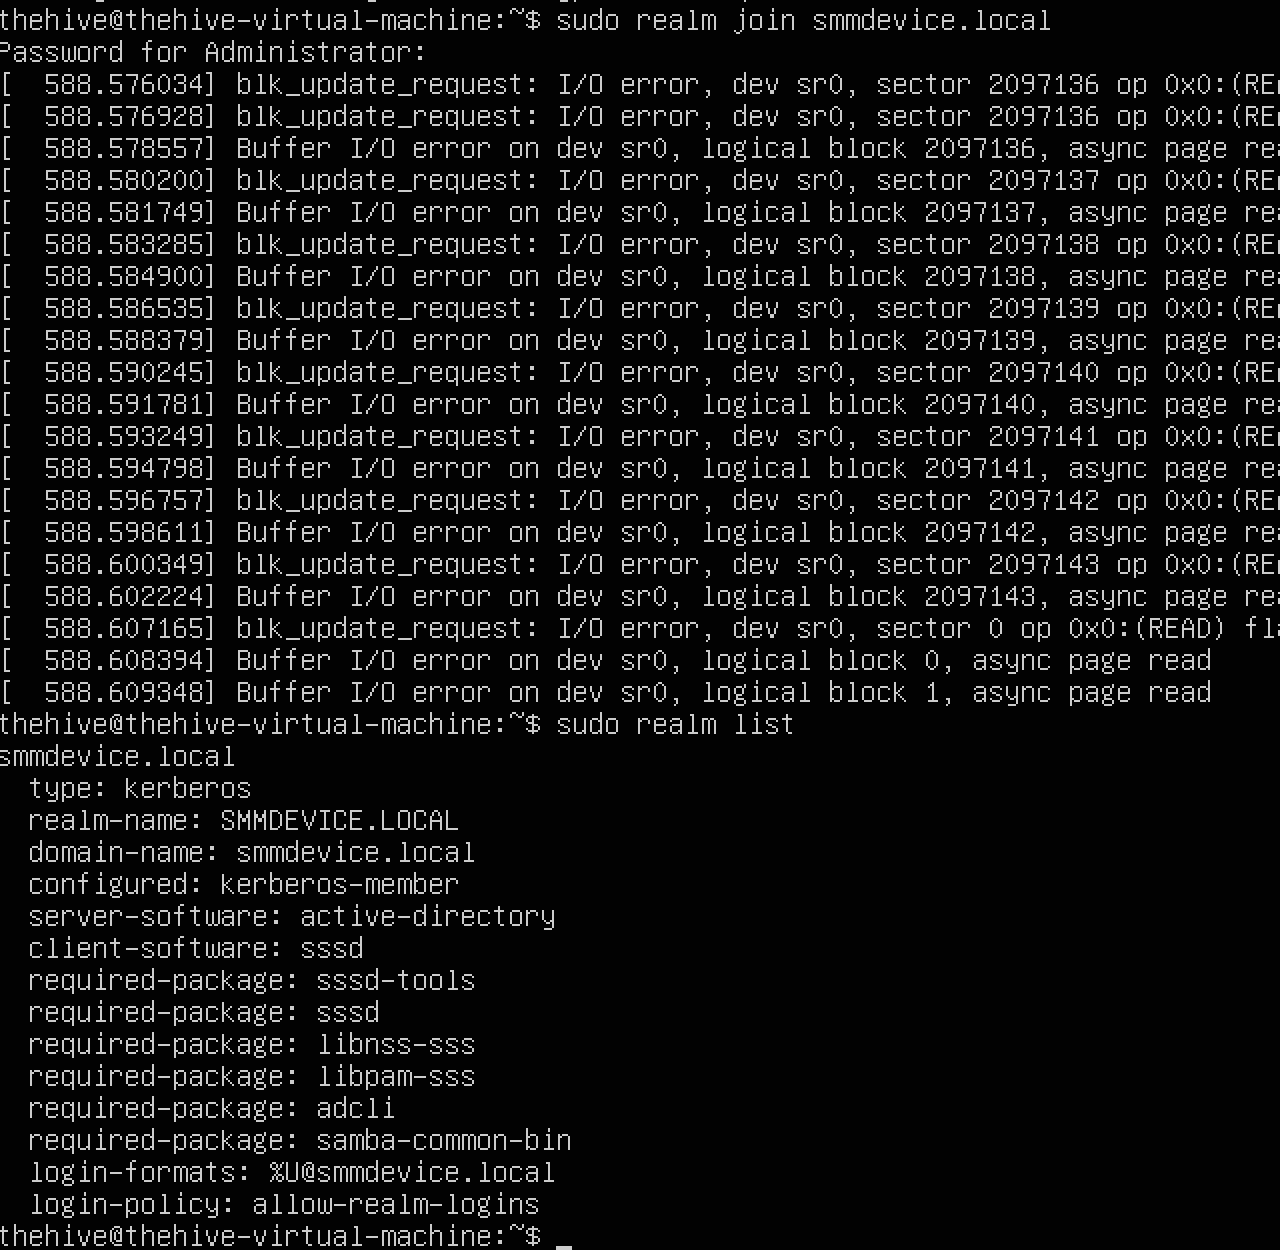
After logging on, we'll run updates, domain-join the machine using realms, and begin configuring our Hive instance
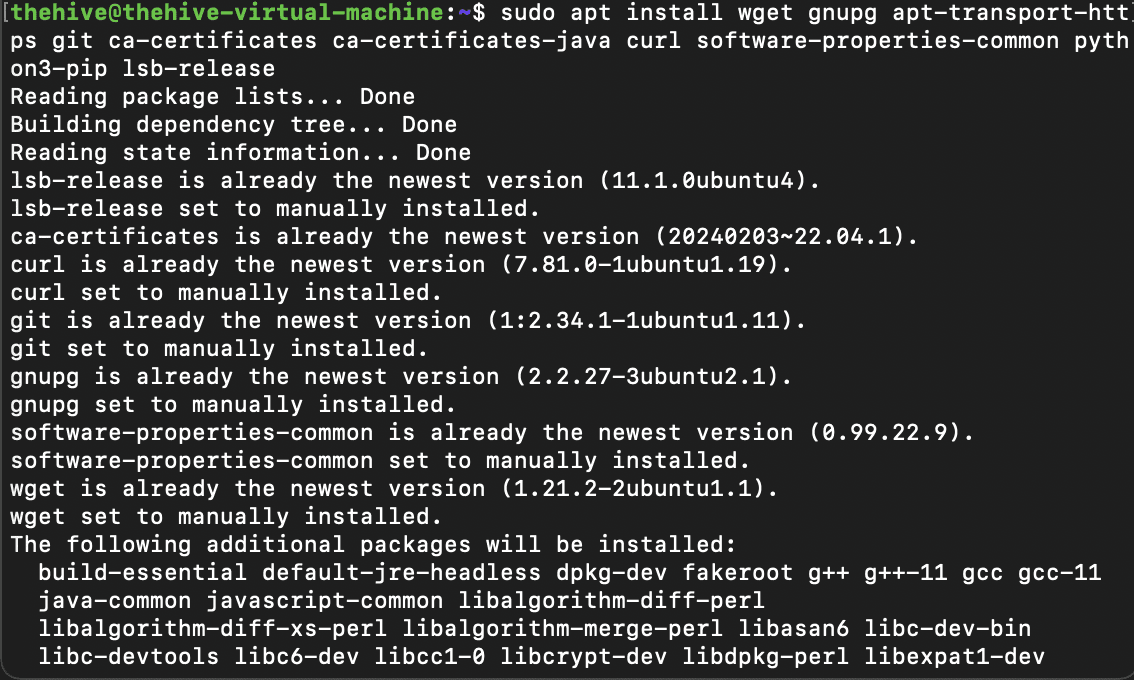
To start, we'll follow the StrangeBee docs for configuring our instance by firstly ensuring that the proper software dependencies are installed. For this, we'll run the command below to install java and python dependencies:
apt install wget gnupg apt-transport-https git ca-certificates ca-certificates-java curl software-properties-common python3-pip lsb-release
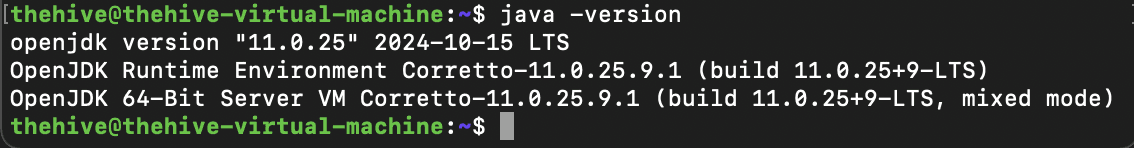
Now that initial dependencies are installed, we'll install Amazon Corretto for Java Virtual machine. We will then verify our JDK and Corretto version by running java —version
wget -qO- https://apt.corretto.aws/corretto.key | sudo gpg --dearmor -o /usr/share/keyrings/corretto.gpg echo "deb [signed-by=/usr/share/keyrings/corretto.gpg] https://apt.corretto.aws stable main" | sudo tee -a /etc/apt/sources.list.d/corretto.sources.list sudo apt update sudo apt install java-common java-11-amazon-corretto-jdk echo JAVA_HOME="/usr/lib/jvm/java-11-amazon-corretto" | sudo tee -a /etc/environment export JAVA_HOME="/usr/lib/jvm/java-11-amazon-corretto"
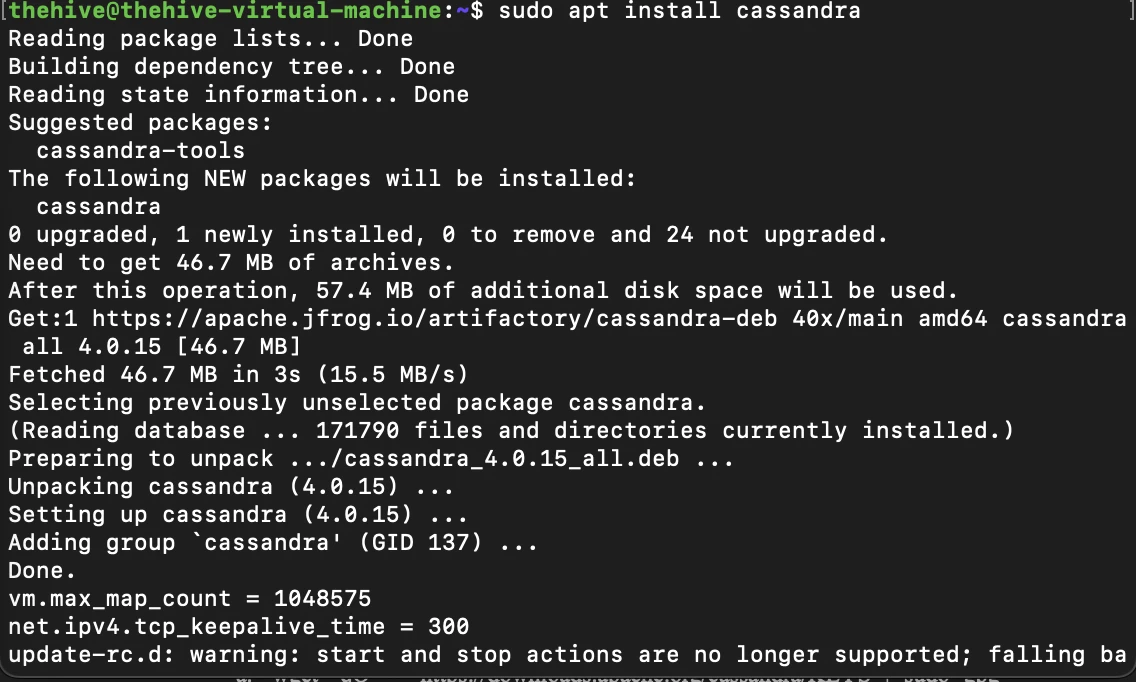
TheHive requires a database system be deployed as it needs to potentially be able to handle a large amount of structured and unstructured data. To begin, we'll need to install Apache Cassandra. For that, we'll first need to import the repository keys, adding the repository to our package manager sources list, then using the below command to perform the installation
wget -qO - https://downloads.apache.org/cassandra/KEYS | sudo gpg --dearmor -o /usr/share/keyrings/cassandra-archive.gpg
echo "deb [signed-by=/usr/share/keyrings/cassandra-archive.gpg] https://debian.cassandra.apache.org 40x main" | sudo tee -a /etc/apt/sources.list.d/cassandra.sources.list
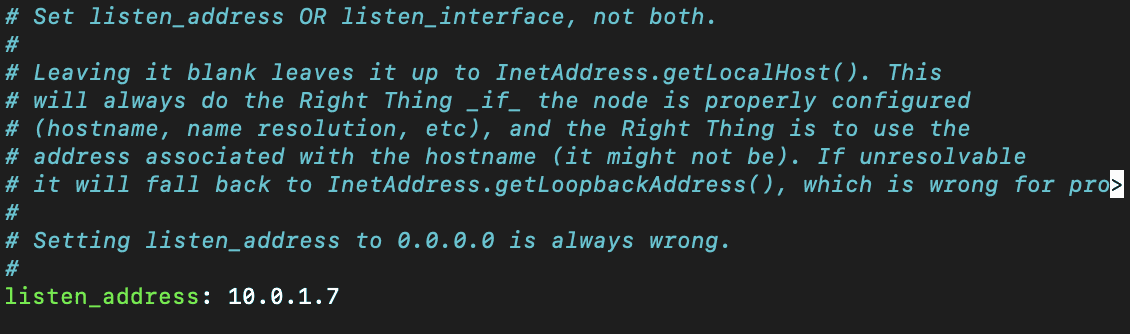
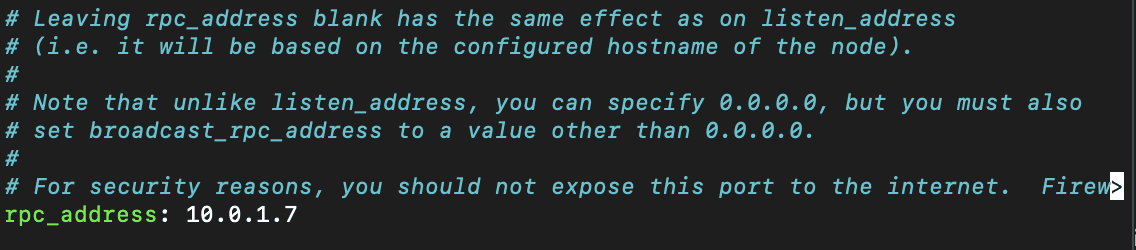
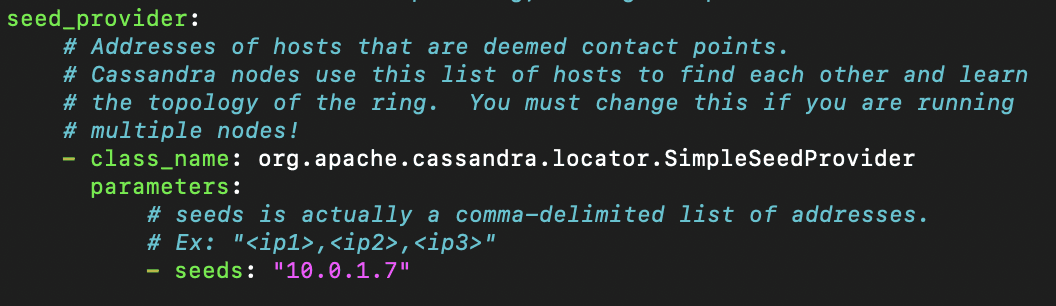
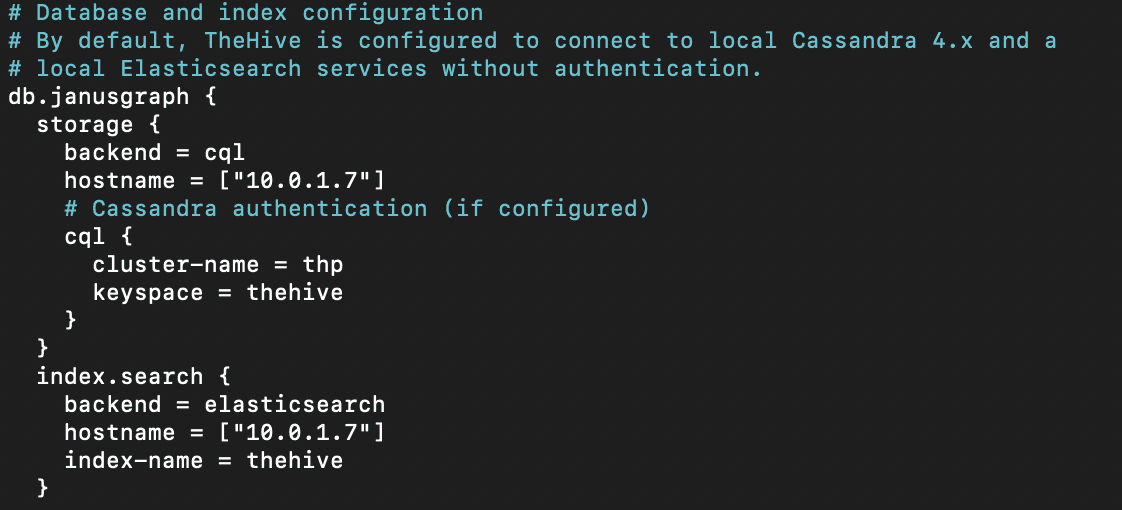
After installation, we'll need to access the Cassandra.yml file to begin making configurations. We'll make the following changes:
listen_address: 10.0.1.7
rpc_address: 10.0.1.7
seed_provider: - seeds: 10.0.1.7
We'll next need to install Elasticsearch on this machine. This is because TheHive relies on Elasticsearch to index and search data. To begin, as before, we'll import the Elastic PGP key. We'll run the two commands below to import the PGP key and add the repository definition to our apt sources list. After importing the repo, we'll begin installation
wget -qO - https://artifacts.elastic.co/GPG-KEY-elasticsearch | sudo gpg --dearmor -o /usr/share/keyrings/elasticsearch-keyring.gpg
echo "deb [signed-by=/usr/share/keyrings/elasticsearch-keyring.gpg] https://artifacts.elastic.co/packages/7.x/apt stable main" | sudo tee /etc/apt/sources.list.d/elastic-7.x.list

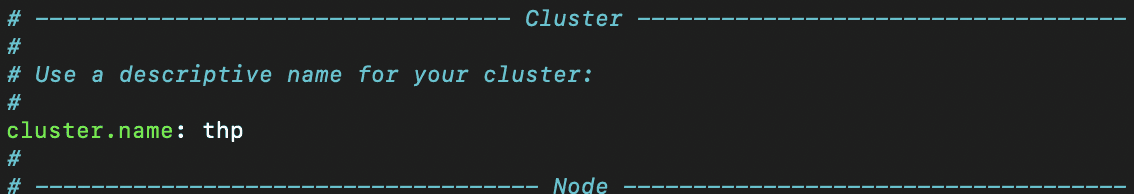
After installing Elastic search, we'll need to make a few changes to the configuration to properly integrate it with the hive. We'll make the following changes:
cluster.name: thp
discovery.type: single-node
network.host: 10.0.1.7
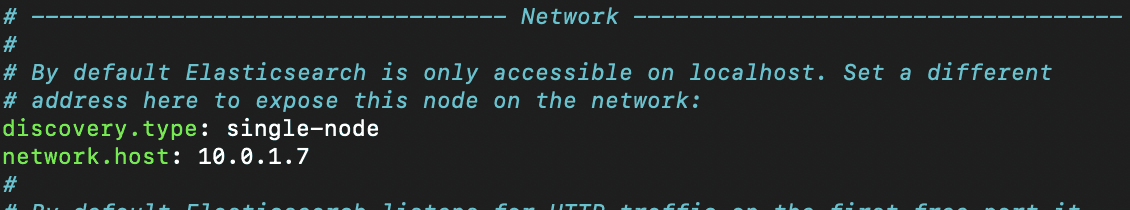
We will then start the elasticsearch service, and verify it is listening on tcp/9200

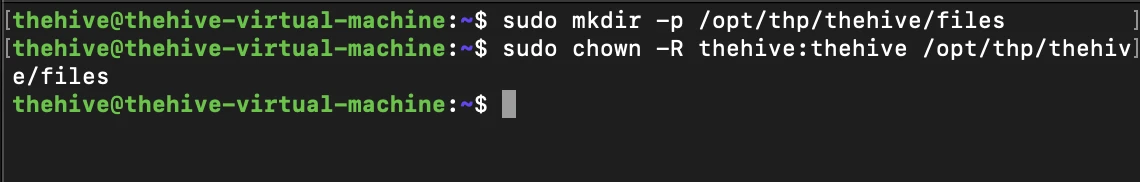
We will store the log and configuration files for TheHive on our local machine, and will therefore need to make the directories required in order to use TheHive with the local file system. We can do that by running the following commands which will create a new home directory for TheHive, as well as the apply the appropriate permissions
sudo mkdir –p /opt/thp/thehive/files
sudo chown -R thehive:thehive /opt/thp/thehive/files
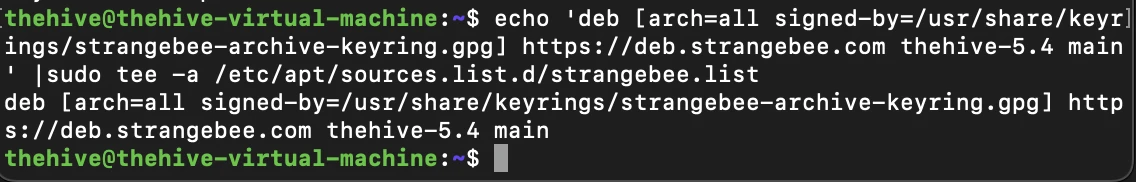
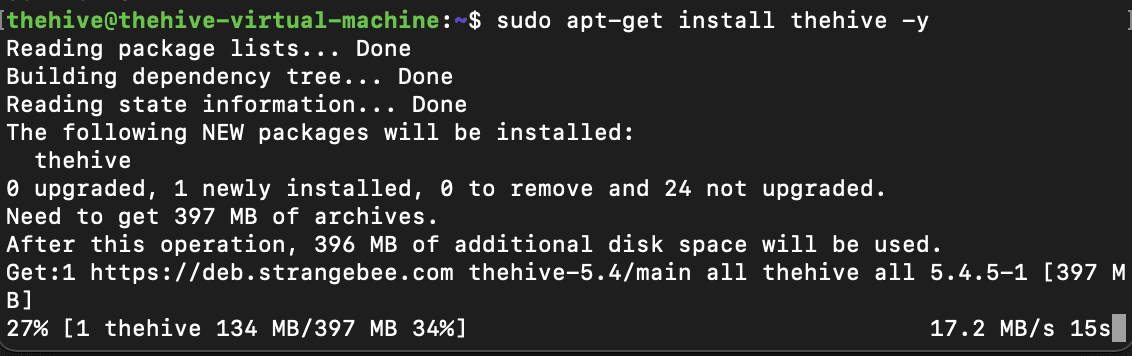
Next, we can proceed with installation. We'll begin by importing TheHive into our repo sources list, update our package manager, and install TheHive
echo 'deb [arch=all signed-by=/usr/share/keyrings/strangebee-archive-keyring.gpg] https://deb.strangebee.com thehive-5.4 main' |sudo tee -a /etc/apt/sources.list.d/strangebee.list sudo apt-get update sudo apt-get install -y thehive
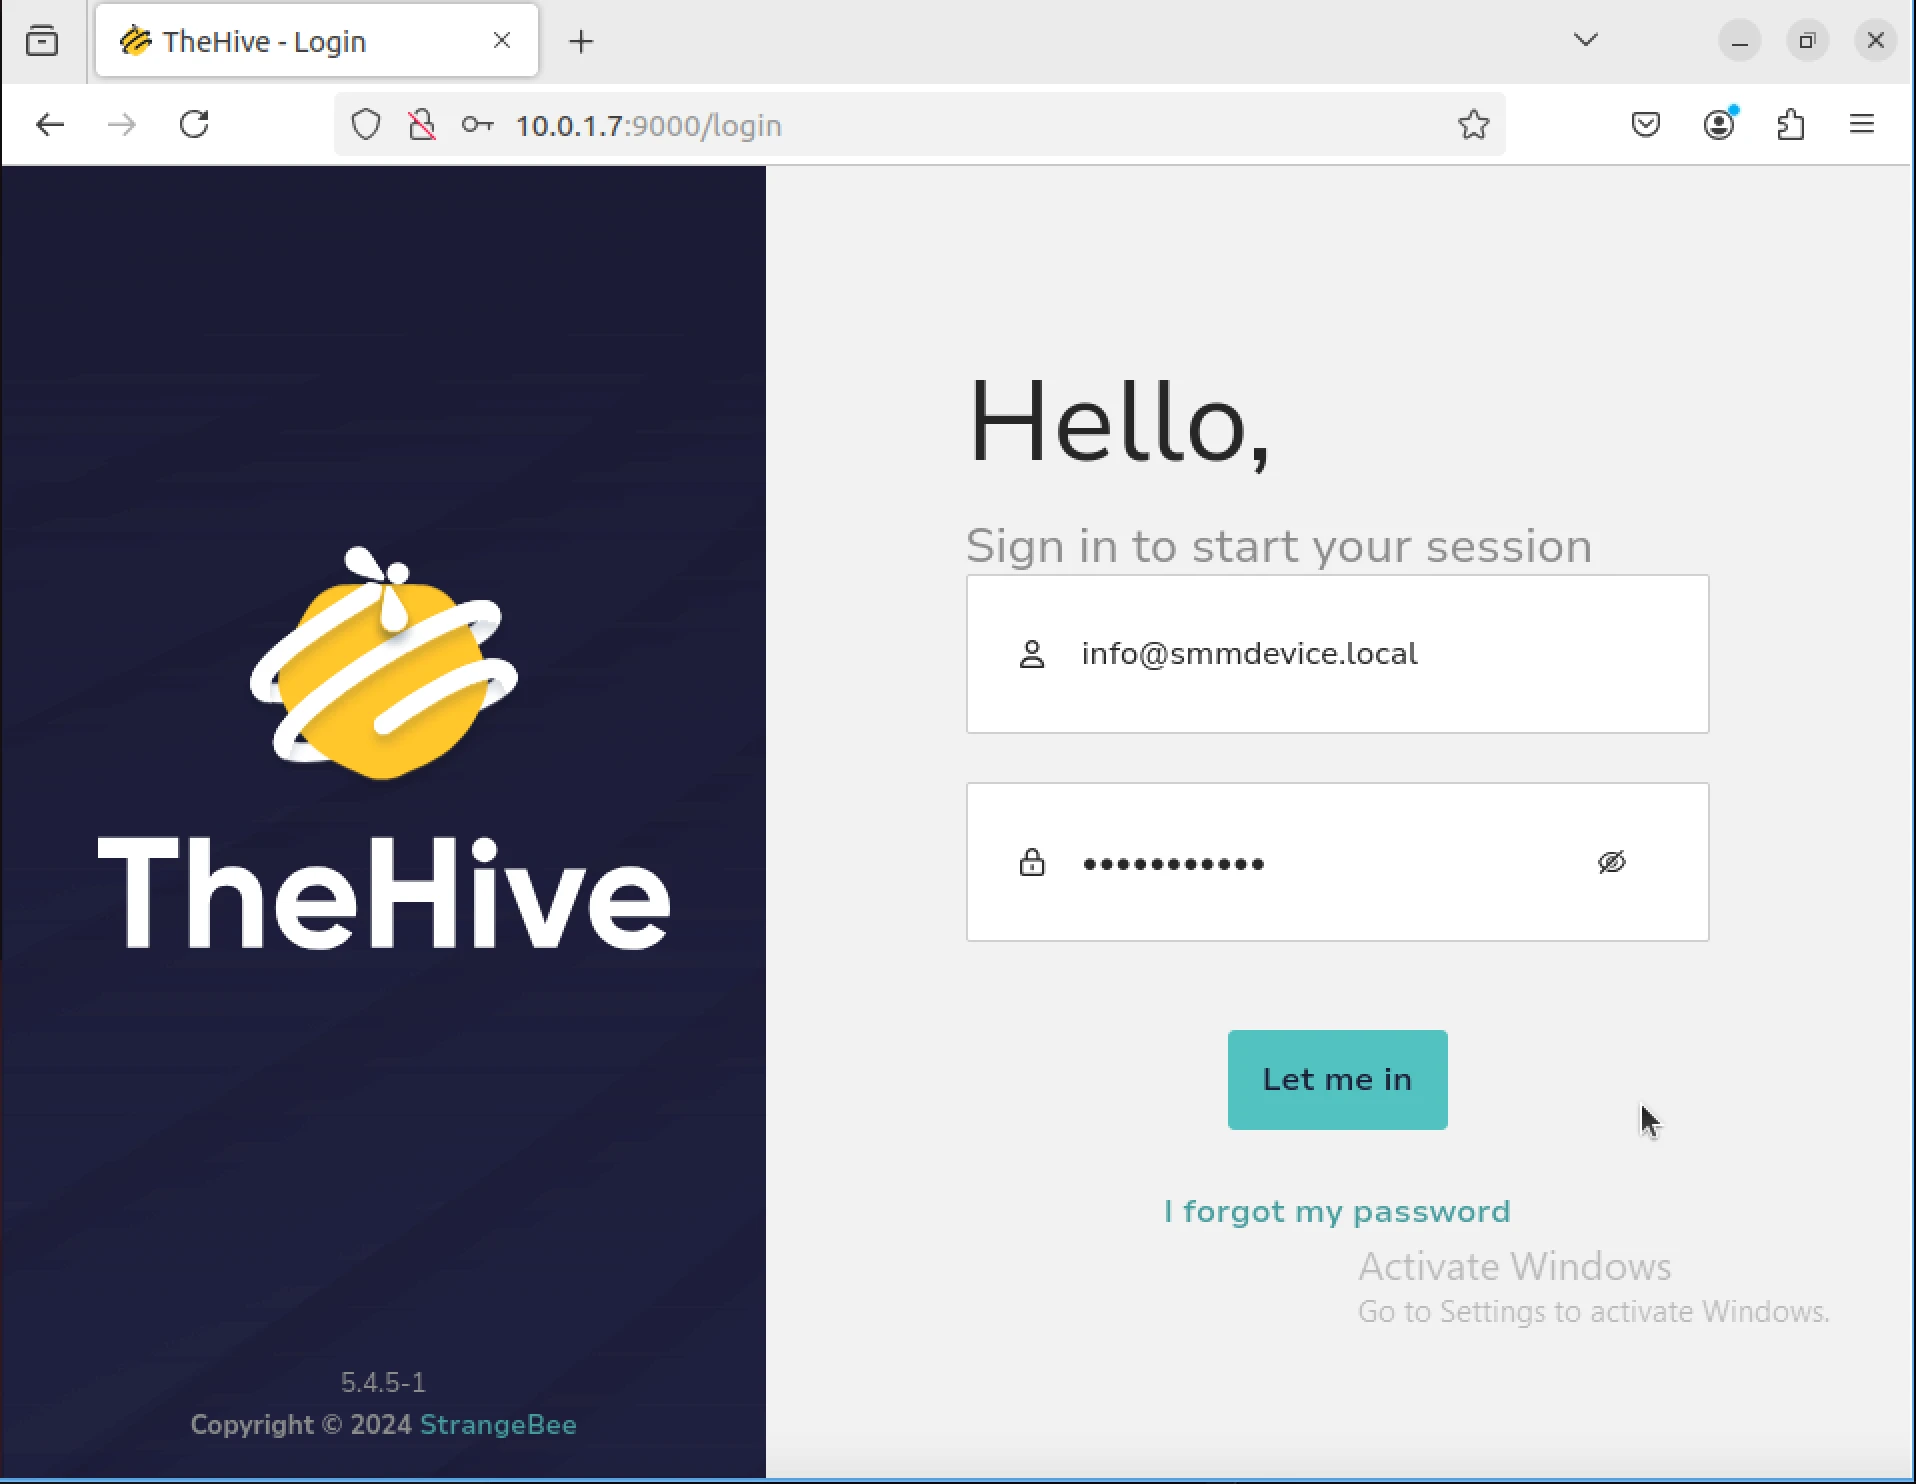
With these configurations in place, and both Cassandra and Elasticsearch now running, we should be able to start thehive and visit the interface hosted at tcp/9000 in our web browser.
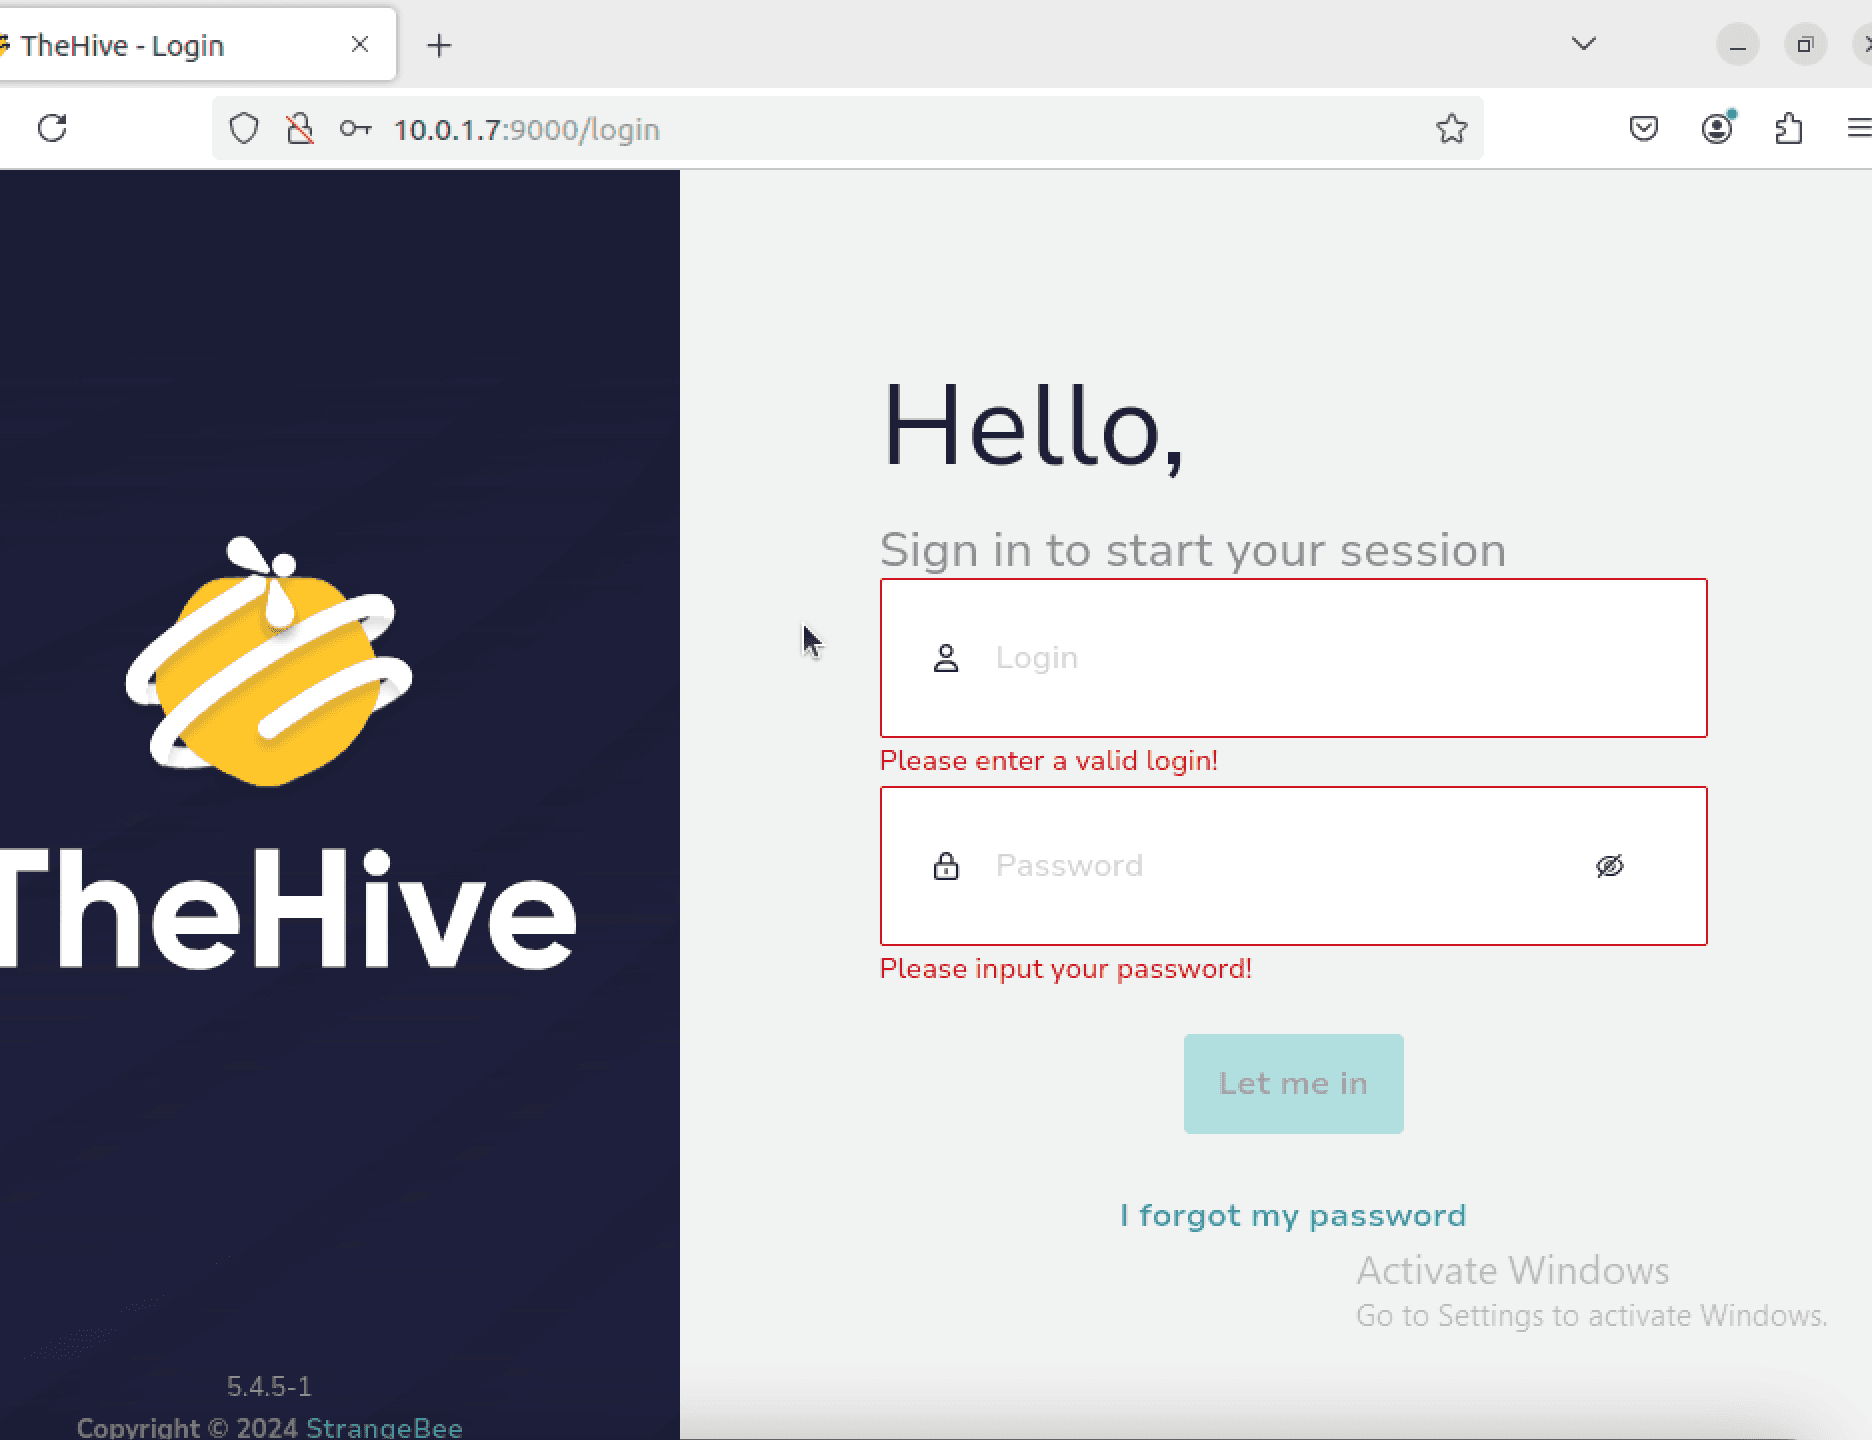
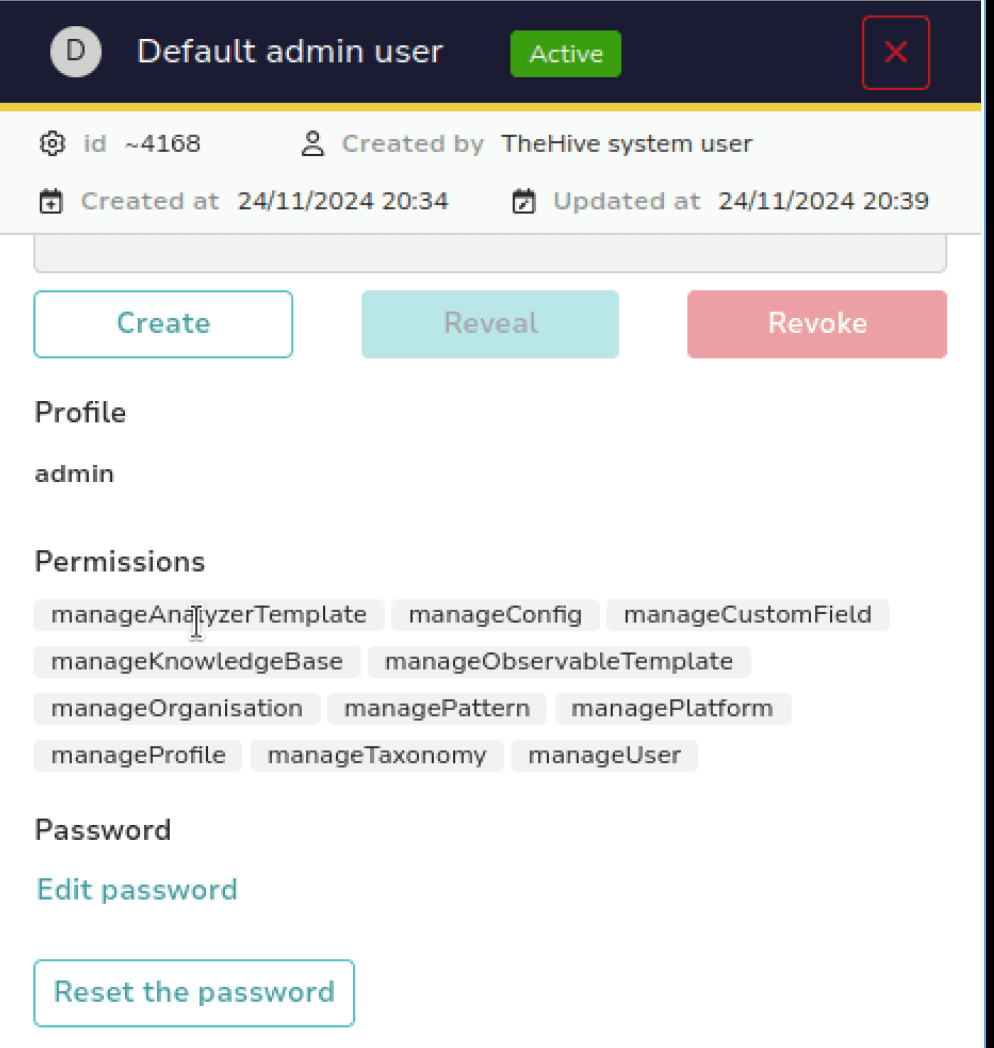
After logging in with credential defaults, we'll firstly want to change these for the built-in admin account
After this is completed, we can begin the process of creating our Organization. TheHive uses organizations as a key concept for structuring and managing access to cases, alerts, and other resources. Each organization acts as its own tenant with its own Cases, Alerts, Observables, etc.
We'll create our "Demo Org" Organization now by selecting Organizations > Add and set its name to Demo. Then, we'll create the first user within that organization that we can use to login with org-admin permissions.
This prevent us from having to logon as the admin user, and allows us to begin triaging cases.
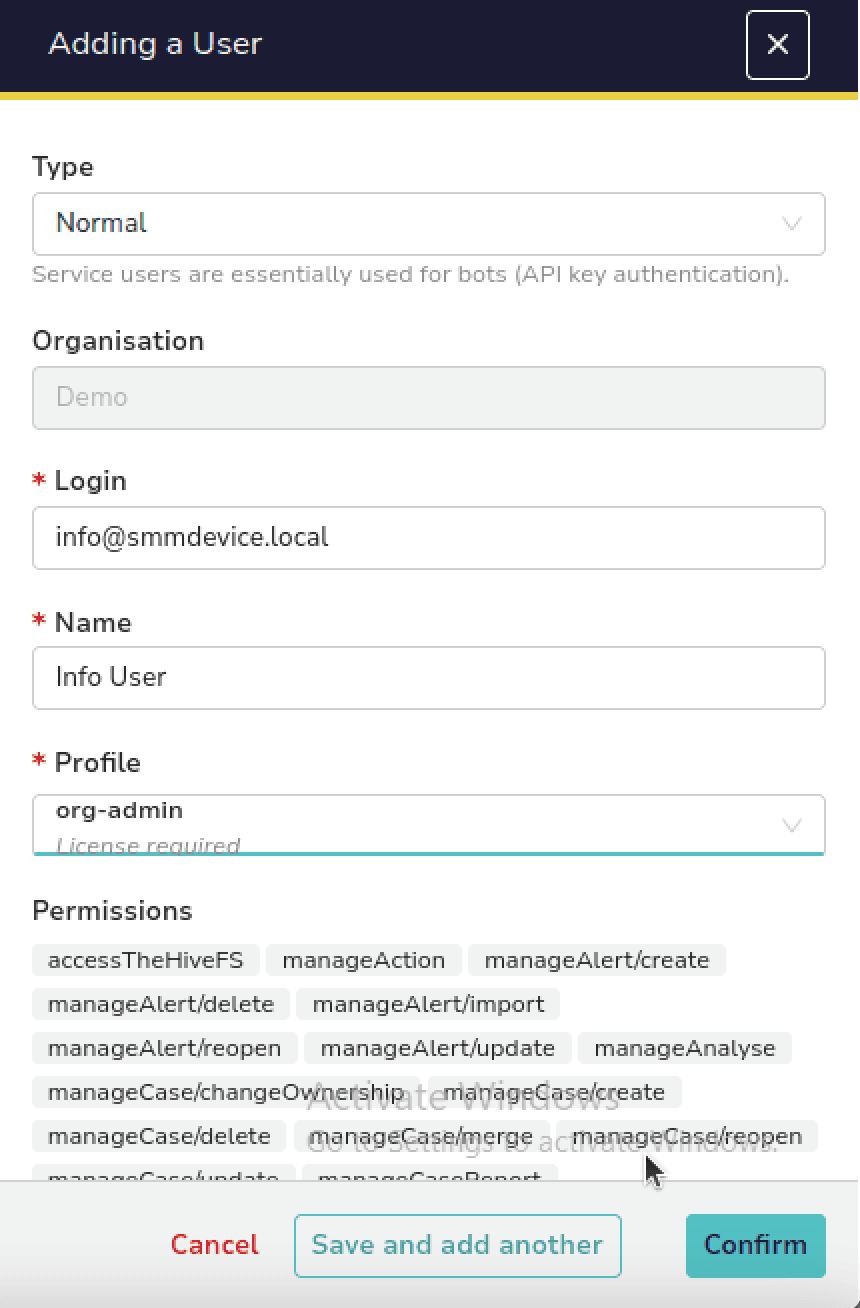
To finalize initial configurations, we'll login as the info@smmdevice.local user account to ensure the credentials work
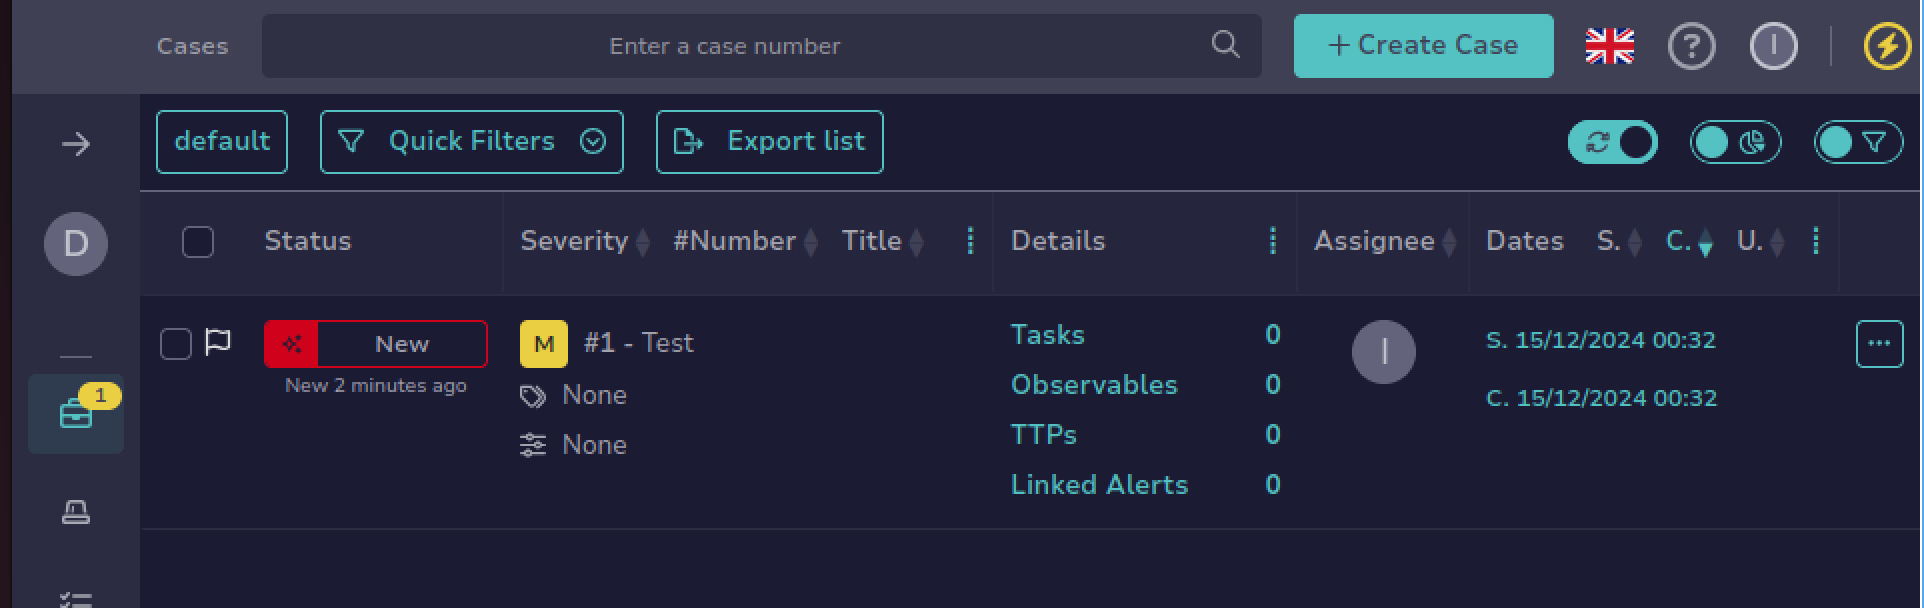
And looks good! Login seems to take, and we're able to create a test case.
Conclusion
This concludes our deployment of SOAR security infrastructure and logging capabilities aligned with NIST SP 800-53. In addition to the deployed tools, we've also encrypted data transfer validated via TLS (SC-12) within the Elastic Stack, Enforced Access Control policies per ISO 27001, and incident response automation has been tested within TheHive platform. From here, we can begin building a variety of security automations to deploy test cases within our environment.